
|
Supplemental Financial Information
|
|||||||||
|
Second Quarter 2011
|
|
Table of Contents
|
PRIMERICA, INC.
|
|
|
Financial Supplement
|
|
Page
|
|
|
Preface, definition of Non-GAAP financial measures
|
3
|
|
Condensed balance sheets and reconciliation of balance sheet non-GAAP to GAAP financial measures
|
4
|
|
Financial results and other statistical data
|
5
|
|
Statements of income
|
6
|
|
Reconciliation of statement of income non-GAAP to GAAP financial measures
|
7
|
|
Segment operating results
|
8
|
|
Term Life Insurance segment - financial results, key statistics, and financial analysis
|
9-10
|
|
Investment and Savings Products segment - financial results, key statistics, and financial analysis
|
11
|
|
Investment portfolio
|
12-15
|
|
Five-year historical key statistics
|
16
|
|
|
|
Preface
|
PRIMERICA, INC.
|
| Financial Supplement |
|
●
|
Operating adjustments exclude the expense associated with equity awards granted in connection with our initial public offering (“IPO”) and the impact of realized investment gains and losses. For periods which include the first quarter of 2010, operating adjustments reflect the impact of our reinsurance and reorganization activities as if they had been effected on January 1, 2010.
|
|
●
|
Adjusted when used in describing stockholders’ equity refers to the removal of the impact of net unrealized gains and losses on invested assets.
|
|
●
|
On March 31, 2010, we reinsured between 80% and 90% of our business that was in-force at year-end 2009 to various affiliates of Citigroup Inc. (“Citi”) and declared extraordinary dividends to Citi.
|
|
●
|
On April 1, 2010, Citi contributed the legal entities comprising our business to us. We issued approximately 75.0 million shares of common stock and warrants exercisable for approximately 4.1 million additional shares of our common stock to Citi. Additionally, we issued a $300.0 million note to Citi, due March 31, 2015 and bearing interest at 5.5% annually.
|
|
●
|
On April 1, 2010, our common stock began trading under the ticker symbol “PRI” on the New York Stock Exchange.
|
|
●
|
On April 1, 2010, Citi sold approximately 24.6 million shares of our common stock (after giving effect to the over-allotment option) to the public in the IPO.
|
|
●
|
On April 1, 2010, Citi contributed approximately 5.0 million shares back to us, which we granted in the form of equity awards to certain of our management and sales force leaders. Of these, approximately 200,000 shares were granted to replace unvested Citi awards.
|
|
●
|
On April 15, 2010, Citi sold approximately 16.4 million shares and the warrants to purchase approximately 4.1 million additional shares of our common stock to private equity funds managed by Warburg Pincus LLC (“Warburg Pincus”) for a purchase price of $230.0 million (the “private sale”). Following the IPO and the private sale, certain historical Citi equity awards immediately vested.
|
|
●
|
Effective as of April 1, 2010, we made elections under Section 338(h)(10) of the Internal Revenue Code, which resulted in changes to our deferred tax balances and reduced stockholders’ equity.
|
|
●
|
Prior to April 2010, our federal income tax return was consolidated into Citi’s federal income tax return. In anticipation of our corporate reorganization, we entered into a tax separation agreement with Citi and prepaid our estimated tax liability to Citi. In accordance with the tax separation agreement, Citi will indemnify the Company and its subsidiaries against any federal, state or local income tax liability for any taxable period ending on or before April 7, 2010, the closing date of the IPO. Our advance tax payments paid to Citi exceeded our actual tax liabilities. As a result, we recorded the overpayment as a return of capital resulting in a reduction of tax assets and a reduction of stockholders' equity.
|
|
Condensed Balance Sheets and Reconciliation of Balance Sheet Non-GAAP to GAAP Financial Measures
|
PRIMERICA, INC.
|
| Financial Supplement |
| (2) | (3) | |||||||||||||||||||||||
|
(Dollars in thousands)
|
Mar 31,
2010
|
Jun 30,
2010
|
Sep 30,
2010
|
Dec 31,
2010
|
Mar 31,
2011
|
Jun 30,
2011
|
||||||||||||||||||
|
Condensed Balance Sheets
|
||||||||||||||||||||||||
|
Assets:
|
||||||||||||||||||||||||
|
Investments and cash
|
$ | 2,983,780 | $ | 2,275,564 | $ | 2,284,127 | $ | 2,279,621 | $ | 2,330,098 | $ | 2,297,013 | ||||||||||||
|
Due from reinsurers
|
3,595,239 | 3,639,298 | 3,694,015 | 3,731,634 | 3,770,966 | 3,795,348 | ||||||||||||||||||
|
Deferred policy acquisition costs
|
702,429 | 745,322 | 798,335 | 853,211 | 908,600 | 966,094 | ||||||||||||||||||
|
Income taxes
|
56,114 | — | — | — | — | — | ||||||||||||||||||
|
Other assets
|
523,584 | 554,950 | 610,518 | 573,055 | 582,080 | 567,482 | ||||||||||||||||||
|
Separate account assets
|
2,222,267 | 2,098,936 | 2,301,896 | 2,446,786 | 2,582,881 | 2,544,429 | ||||||||||||||||||
|
Total assets
|
$ | 10,083,413 | $ | 9,314,070 | $ | 9,688,891 | $ | 9,884,307 | $ | 10,174,625 | $ | 10,170,366 | ||||||||||||
|
Liabilities:
|
||||||||||||||||||||||||
|
Future policy benefits
|
$ | 4,248,277 | $ | 4,286,258 | $ | 4,349,375 | $ | 4,409,183 | $ | 4,470,185 | $ | 4,532,615 | ||||||||||||
|
Other policy liabilities
|
630,294 | 608,307 | 609,047 | 592,711 | 604,487 | 588,202 | ||||||||||||||||||
|
Income taxes
|
— | 129,776 | 127,732 | 136,226 | 142,780 | 130,283 | ||||||||||||||||||
|
Other liabilities
|
1,106,834 | 412,141 | 395,762 | 386,182 | 397,561 | 364,533 | ||||||||||||||||||
|
Note payable
|
— | 300,000 | 300,000 | 300,000 | 300,000 | 300,000 | ||||||||||||||||||
|
Payable under securities lending
|
129,042 | 161,056 | 208,765 | 181,726 | 186,089 | 163,342 | ||||||||||||||||||
|
Separate account liabilities
|
2,222,267 | 2,098,936 | 2,301,896 | 2,446,786 | 2,582,881 | 2,544,429 | ||||||||||||||||||
|
Total liabilities
|
8,336,714 | 7,996,474 | 8,292,577 | 8,452,814 | 8,683,983 | 8,623,404 | ||||||||||||||||||
|
Stockholders’ equity:
|
||||||||||||||||||||||||
|
Common stock ($0.01 par value) (1)
|
— | 727 | 727 | 728 | 732 | 736 | ||||||||||||||||||
|
Paid-in capital
|
1,312,072 | 870,706 | 882,676 | 883,169 | 889,654 | 894,018 | ||||||||||||||||||
|
Retained earnings
|
300,531 | 304,075 | 342,920 | 395,057 | 446,767 | 488,521 | ||||||||||||||||||
|
Treasury stock
|
— | — | — | — | — | — | ||||||||||||||||||
|
Accumulated other comprehensive income (loss), net:
|
||||||||||||||||||||||||
|
Net unrealized investment gains (losses) not other-than-temporarily impaired
|
85,265 | 97,505 | 120,949 | 98,322 | 96,543 | 105,647 | ||||||||||||||||||
|
Net unrealized investment losses other-than-temporarily impaired
|
(4,245 | ) | (3,703 | ) | (2,883 | ) | (2,275 | ) | (2,275 | ) | (2,275 | ) | ||||||||||||
|
Cumulative translation adjustment
|
53,076 | 48,286 | 51,925 | 56,492 | 59,221 | 60,315 | ||||||||||||||||||
|
Total stockholders’ equity
|
1,746,699 | 1,317,596 | 1,396,314 | 1,431,493 | 1,490,642 | 1,546,962 | ||||||||||||||||||
|
Total liabilities and stockholders' equity
|
$ | 10,083,413 | $ | 9,314,070 | $ | 9,688,891 | $ | 9,884,307 | $ | 10,174,625 | $ | 10,170,366 | ||||||||||||
|
Reconciliation of Adjusted Stockholders' Equity to Total Stockholders' Equity
|
||||||||||||||||||||||||
|
Adjusted stockholders' equity
|
$ | 1,665,679 | $ | 1,223,794 | $ | 1,278,248 | $ | 1,335,446 | $ | 1,396,374 | $ | 1,443,590 | ||||||||||||
|
Reconciling items:
|
||||||||||||||||||||||||
|
Net unrealized investment gains (losses) not other-than-temporarily impaired
|
85,265 | 97,505 | 120,949 | 98,322 | 96,543 | 105,647 | ||||||||||||||||||
|
Net unrealized investment losses other-than-temporarily impaired
|
(4,245 | ) | (3,703 | ) | (2,883 | ) | (2,275 | ) | (2,275 | ) | (2,275 | ) | ||||||||||||
|
Total reconciling items
|
81,020 | 93,802 | 118,066 | 96,047 | 94,268 | 103,372 | ||||||||||||||||||
|
Total stockholders’ equity
|
$ | 1,746,699 | $ | 1,317,596 | $ | 1,396,314 | $ | 1,431,493 | $ | 1,490,642 | $ | 1,546,962 | ||||||||||||
|
Deferred Policy Acquisition Costs Rollforward
|
||||||||||||||||||||||||
|
Balance, beginning of period
|
$ | 2,789,905 | $ | 702,429 | $ | 745,322 | $ | 798,335 | $ | 853,211 | $ | 908,600 | ||||||||||||
|
General expenses deferred
|
16,095 | 15,061 | 14,876 | 14,481 | 14,123 | 16,946 | ||||||||||||||||||
|
Commission costs deferred
|
77,208 | 56,831 | 57,232 | 65,285 | 60,296 | 66,661 | ||||||||||||||||||
|
Amortization of deferred policy acquisition costs
|
(91,756 | ) | (22,899 | ) | (23,844 | ) | (29,536 | ) | (25,556 | ) | (27,385 | ) | ||||||||||||
|
Transferred to reinsurers
|
(2,099,941 | ) | — | — | — | — | — | |||||||||||||||||
|
Foreign currency impact and other, net
|
10,918 | (6,100 | ) | 4,750 | 4,646 | 6,527 | 1,272 | |||||||||||||||||
|
Balance, end of period
|
$ | 702,429 | $ | 745,322 | $ | 798,335 | $ | 853,211 | $ | 908,600 | $ | 966,094 | ||||||||||||
|
(1)
|
Outstanding common shares exclude restricted stock units.
|
|
(2)
|
The balance sheet as of March 31, 2010 reflects the impact of the Citi reinsurance transactions executed on March 31, 2010. The Citi reinsurance transactions were given retroactive effect to January 1, 2010. As a result, the first quarter 2010 balance sheet includes a return of capital to Citi equally offsetting the income attributable to the underlying policies earned between January 1, 2010 and March 31, 2010. The first quarter 2010 balance sheet also reflects the extraordinary dividends declared on March 31, 2010.
|
|
(3)
|
The balance sheet as of June 30, 2010 reflects the issuance of the Citi note, reductions to stockholders' equity and corresponding changes in deferred tax balances as a result of the 338(h)(10) elections, and a reduction in stockholders' equity as a result of reflecting our overpayment of estimated taxes to Citi as a return of capital.
|
|
Financial Results and Other Statistical Data
|
PRIMERICA, INC.
|
|
Financial Supplement
|
|
Q1
2010
|
Q2
2010
|
Q3
2010
|
Q4
2010
|
Q1
2011
|
Q2
2011
|
YOY Q2
|
||||||||||||||||||||||||||||||
|
(Dollars in thousands, except per-share data)
|
$
Change
|
%
Change
|
YTD
2011
|
|||||||||||||||||||||||||||||||||
|
Earnings per Share
|
||||||||||||||||||||||||||||||||||||
|
Basic earnings per share:
|
||||||||||||||||||||||||||||||||||||
|
Weighted-average common shares and fully vested equity awards
|
na
|
71,843,588 | 72,259,352 | 72,453,126 | 72,671,481 | 73,457,333 | 1,613,745 | 2.2 | % | 73,066,578 | ||||||||||||||||||||||||||
|
Net income
|
na
|
$ | 22,008 | $ | 39,595 | $ | 52,889 | $ | 52,467 | $ | 44,023 | $ | 22,015 | 100.0 | % | $ | 96,491 | |||||||||||||||||||
|
Less income attributable to unvested participating securities
|
na
|
(928 | ) | (1,540 | ) | (2,051 | ) | (2,103 | ) | (1,284 | ) | (356 | ) | -38.4 | % | (3,225 | ) | |||||||||||||||||||
|
Net income used in computing basic EPS
|
na
|
$ | 21,080 | $ | 38,055 | $ | 50,838 | $ | 50,364 | $ | 42,739 | $ | 21,659 | 102.7 | % | $ | 93,266 | |||||||||||||||||||
|
Basic earnings per share
|
na
|
$ | 0.29 | $ | 0.53 | $ | 0.70 | $ | 0.69 | $ | 0.58 | $ | 0.29 | 98.3 | % | $ | 1.28 | |||||||||||||||||||
|
Net operating income
|
na
|
$ | 37,199 | $ | 40,913 | $ | 45,217 | $ | 48,629 | $ | 44,999 | $ | 7,799 | 21.0 | % | $ | 93,628 | |||||||||||||||||||
|
Less operating income attributable to unvested participating securities
|
na
|
(1,569 | ) | (1,591 | ) | (1,753 | ) | (1,949 | ) | (1,313 | ) | 256 | 16.3 | % | (3,129 | ) | ||||||||||||||||||||
|
Net operating income used in computing basic operating EPS
|
na
|
$ | 35,631 | $ | 39,322 | $ | 43,464 | $ | 46,680 | $ | 43,686 | $ | 8,055 | 22.6 | % | $ | 90,498 | |||||||||||||||||||
|
Basic operating income per share
|
na
|
$ | 0.50 | $ | 0.54 | $ | 0.60 | $ | 0.64 | $ | 0.59 | $ | 0.10 | 19.9 | % | $ | 1.24 | |||||||||||||||||||
|
Diluted earnings per share:
|
||||||||||||||||||||||||||||||||||||
|
Weighted-average common shares and fully vested equity awards
|
na
|
71,843,588 | 72,259,352 | 72,453,126 | 72,671,481 | 73,457,333 | 1,613,745 | 2.2 | % | 73,066,578 | ||||||||||||||||||||||||||
|
Dilutive impact of warrants
|
na
|
890,777 | 660,066 | 786,628 | 1,154,597 | 743,814 | (146,963 | ) | -16.5 | % | 960,944 | |||||||||||||||||||||||||
|
Shares used to calculate diluted EPS
|
na
|
72,734,365 | 72,919,418 | 73,239,754 | 73,826,078 | 74,201,147 | 1,466,782 | 2.0 | % | 74,027,522 | ||||||||||||||||||||||||||
|
Net income
|
na
|
$ | 22,008 | $ | 39,595 | $ | 52,889 | $ | 52,467 | $ | 44,023 | $ | 22,015 | 100.0 | % | $ | 96,491 | |||||||||||||||||||
|
Less income attributable to unvested participating securities
|
na
|
(917 | ) | (1,527 | ) | (2,030 | ) | (2,072 | ) | (1,272 | ) | (355 | ) | -38.7 | % | (3,186 | ) | |||||||||||||||||||
|
Net income used in computing diluted EPS
|
na
|
$ | 21,091 | $ | 38,068 | $ | 50,859 | $ | 50,395 | $ | 42,751 | $ | 21,660 | 102.7 | % | $ | 93,305 | |||||||||||||||||||
|
Diluted earnings per share
|
na
|
$ | 0.29 | $ | 0.52 | $ | 0.69 | $ | 0.68 | $ | 0.58 | $ | 0.29 | 98.7 | % | $ | 1.26 | |||||||||||||||||||
|
Net operating income
|
na
|
$ | 37,199 | $ | 40,913 | $ | 45,217 | $ | 48,629 | $ | 44,999 | $ | 7,799 | 21.0 | % | $ | 93,628 | |||||||||||||||||||
|
Less operating income attributable to unvested participating securities
|
na
|
(1,550 | ) | (1,578 | ) | (1,735 | ) | (1,920 | ) | (1,301 | ) | 250 | 16.1 | % | (3,091 | ) | ||||||||||||||||||||
|
Net operating income used in computing diluted operating EPS
|
na
|
$ | 35,649 | $ | 39,335 | $ | 43,482 | $ | 46,709 | $ | 43,698 | $ | 8,049 | 22.6 | % | $ | 90,537 | |||||||||||||||||||
|
Diluted operating income per share
|
na
|
$ | 0.49 | $ | 0.54 | $ | 0.59 | $ | 0.63 | $ | 0.59 | $ | 0.10 | 20.2 | % | $ | 1.22 | |||||||||||||||||||
|
YOY Q2
|
||||||||||||||||||||||||||||||||||||
|
Q1
2010
|
Q2
2010
|
Q3
2010
|
Q4
2010
|
Q1
2011
|
Q2
2011
|
Change
|
%
Change
|
YTD
2011
|
||||||||||||||||||||||||||||
|
Annualized Return on Equity
|
||||||||||||||||||||||||||||||||||||
|
Average stockholders' equity
|
na
|
$ | 1,296,220 | $ | 1,356,955 | $ | 1,413,904 | $ | 1,461,068 | $ | 1,518,802 | $ | 222,583 | 17.2% | $ | 1,489,935 | ||||||||||||||||||||
|
Average adjusted stockholders' equity
|
na
|
$ | 1,208,809 | $ | 1,251,021 | $ | 1,306,847 | $ | 1,365,910 | $ | 1,419,982 | $ | 211,174 | 17.5% | $ | 1,392,946 | ||||||||||||||||||||
|
Net income return on stockholders' equity
|
na
|
6.8 | % | 11.7 | % | 15.0 | % | 14.4 | % | 11.6 | % | 4.8 | % |
nm
|
13.0 | % | ||||||||||||||||||||
|
Net income return on adjusted stockholders' equity
|
na
|
7.3 | % | 12.7 | % | 16.2 | % | 15.4 | % | 12.4 | % | 5.1 | % |
nm
|
13.9 | % | ||||||||||||||||||||
|
Net operating income return on adjusted stockholders' equity
|
na
|
12.3 | % | 13.1 | % | 13.8 | % | 14.2 | % | 12.7 | % | 0.4 | % |
nm
|
13.4 | % | ||||||||||||||||||||
|
Capital Structure
|
||||||||||||||||||||||||||||||||||||
|
Debt-to-capital (1)
|
na
|
18.5 | % | 17.7 | % | 17.3 | % | 16.8 | % | 16.2 | % | -2.3 | % |
nm
|
16.2 | % | ||||||||||||||||||||
|
Cash and invested assets to stockholders' equity
|
na
|
1.7 | x | 1.6 | x | 1.6 | x | 1.6 | x | 1.5 | x | (0.2x | ) |
nm
|
1.5 | x | ||||||||||||||||||||
|
Cash and invested assets to adjusted stockholders' equity
|
na
|
1.9 | x | 1.8 | x | 1.7 | x | 1.7 | x | 1.6 | x | (0.3x | ) |
nm
|
1.6 | x | ||||||||||||||||||||
|
Share count, end of period (2)
|
na
|
72,729,617 | 72,727,173 | 72,843,213 | 73,187,837 | 73,603,111 | 873,494 | 1.2% | 73,603,111 | |||||||||||||||||||||||||||
|
Adjusted stockholders' equity per share
|
na
|
$ | 16.83 | $ | 17.58 | $ | 18.33 | $ | 19.08 | $ | 19.61 | $ | 2.79 | 16.6% | $ | 19.61 | ||||||||||||||||||||
|
Financial Strength Ratings - Primerica Life Insurance Company
|
||||||||||||||||||||||||||||||||||||
|
Moody's
|
na
|
na
|
na
|
na
|
na
|
A2 |
nm
|
nm
|
nm
|
|||||||||||||||||||||||||||
|
S&P
|
AA
|
AA-
|
AA-
|
AA-
|
AA-
|
AA-
|
nm
|
nm
|
nm
|
|||||||||||||||||||||||||||
|
A.M. Best
|
A+ | A+ | A+ | A+ | A+ | A+ |
nm
|
nm
|
nm
|
|||||||||||||||||||||||||||
|
Fitch
|
A+ | A+ | A+ | A+ | A+ | A+ |
nm
|
nm
|
nm
|
|||||||||||||||||||||||||||
|
Holding Company Senior Debt Ratings
|
||||||||||||||||||||||||||||||||||||
|
Moody's
|
na
|
na
|
na
|
na
|
na
|
Baa2
|
nm
|
nm
|
nm
|
|||||||||||||||||||||||||||
|
S&P
|
na
|
na
|
na
|
na
|
na
|
A- |
nm
|
nm
|
nm
|
|||||||||||||||||||||||||||
|
A.M. Best
|
na
|
na
|
na
|
na
|
na
|
a- |
nm
|
nm
|
nm
|
|||||||||||||||||||||||||||
|
(1)
|
Capital in the debt-to-capital ratio includes stockholders' equity and the note payable.
|
||||||||||||||||||||
|
(2)
|
Share count reflects outstanding common shares, including restricted shares, but excludes restricted stock units (RSUs).
|
||||||||||||||||||||
|
Statements of Income
|
PRIMERICA, INC.
|
| Financial Supplement |
| (4) |
YOY Q2
|
|||||||||||||||||||||||||||||||||||
|
(Dollars in thousands)
|
Q1
2010
|
Q2
2010
|
Q3
2010
|
Q4
2010
|
Q1
2011
|
Q2
2011
|
$
Change
|
%
Change
|
YTD
2011
|
|||||||||||||||||||||||||||
|
Statement of Income
|
||||||||||||||||||||||||||||||||||||
|
Revenues:
|
||||||||||||||||||||||||||||||||||||
|
Direct premiums
|
$ | 537,845 | $ | 547,455 | $ | 547,444 | $ | 548,330 | $ | 552,069 | $ | 560,881 | $ | 13,426 | 2.5 | % | $ | 1,112,950 | ||||||||||||||||||
|
Ceded premiums
|
(148,119 | ) | (447,213 | ) | (437,054 | ) | (417,981 | ) | (422,238 | ) | (435,564 | ) | 11,649 | 2.6 | % | (857,802 | ) | |||||||||||||||||||
|
Net premiums
|
389,726 | 100,242 | 110,390 | 130,349 | 129,831 | 125,317 | 25,075 | 25.0 | % | 255,148 | ||||||||||||||||||||||||||
|
Net investment income
|
82,576 | 27,991 | 27,855 | 26,688 | 28,626 | 27,229 | (762 | ) | -2.7 | % | 55,855 | |||||||||||||||||||||||||
|
Commissions and fees:
|
||||||||||||||||||||||||||||||||||||
|
Sales-based (1)
|
36,363 | 36,301 | 32,941 | 37,001 | 43,128 | 44,904 | 8,603 | 23.7 | % | 88,032 | ||||||||||||||||||||||||||
|
Asset-based (2)
|
38,014 | 39,445 | 37,602 | 52,412 | 44,825 | 45,348 | 5,904 | 15.0 | % | 90,174 | ||||||||||||||||||||||||||
|
Account-based (3)
|
10,208 | 10,317 | 10,620 | 10,545 | 10,432 | 11,811 | 1,493 | 14.5 | % | 22,242 | ||||||||||||||||||||||||||
|
Other commissions and fees
|
7,105 | 7,162 | 8,574 | 8,331 | 7,731 | 6,635 | (528 | ) | -7.4 | % | 14,366 | |||||||||||||||||||||||||
|
Realized investment (losses) gains
|
31,057 | 374 | 1,015 | 1,700 | 327 | 2,035 | 1,661 |
nm
|
2,362 | |||||||||||||||||||||||||||
|
Other, net
|
11,893 | 12,466 | 12,239 | 12,362 | 11,452 | 11,816 | (650 | ) | -5.2 | % | 23,268 | |||||||||||||||||||||||||
|
Total revenues
|
606,942 | 234,299 | 241,236 | 279,387 | 276,352 | 275,095 | 40,796 | 17.4 | % | 551,447 | ||||||||||||||||||||||||||
|
Benefits and expenses:
|
||||||||||||||||||||||||||||||||||||
|
Benefits and claims
|
170,735 | 45,124 | 49,811 | 52,033 | 57,635 | 57,272 | 12,148 | 26.9 | % | 114,907 | ||||||||||||||||||||||||||
|
Amortization of DAC
|
91,756 | 22,899 | 23,844 | 29,536 | 25,556 | 27,385 | 4,486 | 19.6 | % | 52,941 | ||||||||||||||||||||||||||
|
Insurance commissions
|
6,371 | 4,233 | 5,100 | 4,205 | 5,000 | 4,219 | (14 | ) |
nm
|
9,219 | ||||||||||||||||||||||||||
|
Insurance expenses
|
37,529 | 10,083 | 11,999 | 15,887 | 9,552 | 19,154 | 9,071 | 90.0 | % | 28,706 | ||||||||||||||||||||||||||
|
Sales commissions:
|
||||||||||||||||||||||||||||||||||||
|
Sales-based (1)
|
26,203 | 25,998 | 23,474 | 25,319 | 30,547 | 31,378 | 5,381 | 20.7 | % | 61,925 | ||||||||||||||||||||||||||
|
Asset-based (2)
|
12,715 | 12,911 | 12,232 | 20,271 | 15,451 | 15,111 | 2,200 | 17.0 | % | 30,562 | ||||||||||||||||||||||||||
|
Other sales commissions
|
4,963 | 4,603 | 6,558 | 4,676 | 4,358 | 3,674 | (929 | ) | -20.2 | % | 8,032 | |||||||||||||||||||||||||
|
Interest expense
|
— | 6,928 | 6,968 | 6,976 | 6,997 | 6,998 | 70 | 1.0 | % | 13,995 | ||||||||||||||||||||||||||
|
Other operating expenses
|
36,268 | 65,183 | 39,371 | 39,962 | 40,111 | 41,743 | (23,440 | ) | -36.0 | % | 81,854 | |||||||||||||||||||||||||
|
Total benefits and expenses
|
386,541 | 197,961 | 179,357 | 198,865 | 195,207 | 206,934 | 8,973 | 4.5 | % | 402,141 | ||||||||||||||||||||||||||
|
Income before income taxes
|
220,402 | 36,338 | 61,879 | 80,522 | 81,145 | 68,161 | 31,823 | 87.6 | % | 149,306 | ||||||||||||||||||||||||||
|
Income taxes
|
77,116 | 14,330 | 22,284 | 27,633 | 28,678 | 24,138 | 9,808 | 68.4 | % | 52,816 | ||||||||||||||||||||||||||
|
Net income
|
$ | 143,286 | $ | 22,008 | $ | 39,595 | $ | 52,889 | $ | 52,467 | $ | 44,023 | $ | 22,015 | 100.0 | % | $ | 96,490 | ||||||||||||||||||
|
Income Before Income Taxes by Segment
|
||||||||||||||||||||||||||||||||||||
|
Term Life
|
$ | 160,367 | $ | 44,095 | $ | 42,581 | $ | 52,000 | $ | 57,649 | $ | 45,781 | $ | 1,686 | 3.8 | % | $ | 103,430 | ||||||||||||||||||
|
Investment & Savings Products
|
25,447 | 26,735 | 26,578 | 34,769 | 31,039 | 30,470 | 3,735 | 14.0 | % | 61,509 | ||||||||||||||||||||||||||
|
Corporate & Other Distributed Products
|
34,587 | (34,492 | ) | (7,280 | ) | (6,247 | ) | (7,543 | ) | (8,090 | ) | 26,402 | 76.5 | % | (15,633 | ) | ||||||||||||||||||||
|
Income before income taxes
|
$ | 220,402 | $ | 36,338 | $ | 61,879 | $ | 80,522 | $ | 81,145 | $ | 68,161 | $ | 31,823 | 87.6 | % | $ | 149,306 | ||||||||||||||||||
|
(1)
|
Sales-based - revenues or commission expenses relating to the sales of mutual funds and variable annuities
|
|
|
(2)
|
Asset-based - revenues or commission expenses relating to the value of assets in client accounts for which we earn ongoing service, distribution, and other fees
|
|
|
(3)
|
Account-based - revenues relating to the fee generating client accounts we administer
|
|
|
(4)
|
Excludes the effect of the reinsurance and reorganization transactions we executed in connection with and subsequent to our IPO. As such, ceded premiums, net investment income, benefits and claims, amortization of DAC, insurance expenses, interest expense, and other operating expenses exclude the impact of the various Citi reinsurance agreements, dividends, the note payable to Citi, and the equity grants made in connection with our IPO.
|
|
|
Reconciliation of Statement of Income Non-GAAP to GAAP Financial Measures
|
PRIMERICA, INC.
|
| Financial Supplement |
| YOY Q2 | YOY YTD | |||||||||||||||||||||||||||||||||||||||||||||||
|
(Dollars in thousands)
|
Q1
2010
|
Q2
2010
|
Q3
2010
|
Q4
2010
|
Q1
2011
|
Q2
2011
|
$
Change
|
%
Change
|
YTD
2010
|
YTD
2011
|
$
Change
|
%
Change
|
||||||||||||||||||||||||||||||||||||
|
Reconciliation from Operating Revenues to Total Revenues
|
||||||||||||||||||||||||||||||||||||||||||||||||
|
Operating revenues
|
$ | 224,822 | $ | 233,925 | $ | 240,221 | $ | 264,546 | $ | 267,296 | $ | 273,060 | $ | 39,135 | 16.7 | % | $ | 458,747 | $ | 540,356 | $ | 81,610 | 17.8 | % | ||||||||||||||||||||||||
|
Operating revenues reconciling items:
|
||||||||||||||||||||||||||||||||||||||||||||||||
|
Realized investment gains/losses
|
31,057 | 374 | 1,015 | 1,700 | 327 | 2,035 |
nm
|
nm
|
31,431 | 2,362 |
nm
|
nm
|
||||||||||||||||||||||||||||||||||||
|
Ceded premiums - reinsurance recoveries
|
— | — | — | 13,141 | 8,729 | — |
nm
|
nm
|
— | 8,729 |
nm
|
nm
|
||||||||||||||||||||||||||||||||||||
|
Ceded premiums - ceded to Citi reinsurers
|
296,328 | — | — | — | — | — |
nm
|
nm
|
296,328 | — |
nm
|
nm
|
||||||||||||||||||||||||||||||||||||
|
Pro rata net investment income - assets transferred to Citi reinsurers
|
54,735 | — | — | — | — | — |
nm
|
nm
|
54,735 | — |
nm
|
nm
|
||||||||||||||||||||||||||||||||||||
|
Total operating revenues reconciling items
|
382,121 | 374 | 1,015 | 14,841 | 9,056 | 2,035 |
nm
|
nm
|
382,495 | 11,091 |
nm
|
nm
|
||||||||||||||||||||||||||||||||||||
|
Total revenues
|
$ | 606,942 | $ | 234,299 | $ | 241,236 | $ | 279,387 | $ | 276,352 | $ | 275,095 | $ | 40,796 | 17.4 | % | $ | 841,241 | $ | 551,447 | $ | (289,794 | ) | -34.4 | % | |||||||||||||||||||||||
|
Reconciliation from Operating Income Before Income Taxes to Income Before Income Taxes
|
||||||||||||||||||||||||||||||||||||||||||||||||
|
Operating income before income taxes
|
$ | 58,689 | $ | 61,421 | $ | 63,940 | $ | 68,842 | $ | 75,209 | $ | 69,672 | $ | 8,251 | 13.4 | % | $ | 120,109 | $ | 144,881 | $ | 24,771 | 20.6 | % | ||||||||||||||||||||||||
|
Operating income before income taxes reconciling items:
|
||||||||||||||||||||||||||||||||||||||||||||||||
|
Realized investment gains/losses
|
31,057 | 374 | 1,015 | 1,700 | 327 | 2,035 |
nm
|
nm
|
31,431 | 2,362 |
nm
|
nm
|
||||||||||||||||||||||||||||||||||||
|
Ceded premiums - reinsurance recoveries
|
— | — | — | 13,141 | 8,729 | — |
nm
|
nm
|
— | 8,729 |
nm
|
nm
|
||||||||||||||||||||||||||||||||||||
|
Initial & accelerated management / field grant expense
|
— | (25,457 | ) | (3,076 | ) | (3,161 | ) | (3,120 | ) | (3,546 | ) |
nm
|
nm
|
(25,457 | ) | (6,665 | ) |
nm
|
nm
|
|||||||||||||||||||||||||||||
|
Ceded premiums - ceded to Citi reinsurers
|
296,328 | — | — | — | — | — |
nm
|
nm
|
296,328 | — |
nm
|
nm
|
||||||||||||||||||||||||||||||||||||
|
Pro rata net investment income - assets transferred to Citi reinsurers
|
54,735 | — | — | — | — | — |
nm
|
nm
|
54,735 | — |
nm
|
nm
|
||||||||||||||||||||||||||||||||||||
|
Benefits and claims - ceded to Citi reinsurers
|
(128,204 | ) | — | — | — | — | — |
nm
|
nm
|
(128,204 | ) | — |
nm
|
nm
|
||||||||||||||||||||||||||||||||||
|
Amortization of DAC - ceded to Citi reinsurers
|
(71,389 | ) | — | — | — | — | — |
nm
|
nm
|
(71,389 | ) | — |
nm
|
nm
|
||||||||||||||||||||||||||||||||||
|
Insurance commissions - expense allowance received from Citi reinsurers
|
(1,669 | ) | — | — | — | — | — |
nm
|
nm
|
(1,669 | ) | — |
nm
|
nm
|
||||||||||||||||||||||||||||||||||
|
Insurance expenses - expense allowance received from Citi reinsurers
|
(26,083 | ) | — | — | — | — | — |
nm
|
nm
|
(26,083 | ) | — |
nm
|
nm
|
||||||||||||||||||||||||||||||||||
|
Interest expense - finance charge payable to Citi reinsurer
|
2,812 | — | — | — | — | — |
nm
|
nm
|
2,812 | — |
nm
|
nm
|
||||||||||||||||||||||||||||||||||||
|
Interest expense - note payable
|
4,125 | — | — | — | — | — |
nm
|
nm
|
4,125 | — |
nm
|
nm
|
||||||||||||||||||||||||||||||||||||
|
Total operating income before income taxes reconciling items
|
161,713 | (25,083 | ) | (2,061 | ) | 11,680 | 5,936 | (1,511 | ) |
nm
|
nm
|
136,630 | 4,425 |
nm
|
nm
|
|||||||||||||||||||||||||||||||||
|
Income before income taxes
|
$ | 220,402 | $ | 36,338 | $ | 61,879 | $ | 80,522 | $ | 81,145 | $ | 68,161 | $ | 31,823 | 87.6 | % | $ | 256,740 | $ | 149,306 | $ | (107,434 | ) | -41.8 | % | |||||||||||||||||||||||
|
Reconciliation from Net Operating Income to Net Income
|
||||||||||||||||||||||||||||||||||||||||||||||||
|
Net operating income
|
$ | 38,154 | $ | 37,199 | $ | 40,914 | $ | 45,217 | $ | 48,629 | $ | 44,999 | $ | 7,799 | 21.0 | % | $ | 75,353 | $ | 93,628 | $ | 18,274 | 24.3 | % | ||||||||||||||||||||||||
|
Net operating income reconciling items:
|
||||||||||||||||||||||||||||||||||||||||||||||||
|
Operating income before income taxes reconciling items
|
161,713 | (25,083 | ) | (2,061 | ) | 11,680 | 5,936 | (1,511 | ) |
nm
|
nm
|
136,630 | 4,425 |
nm
|
nm
|
|||||||||||||||||||||||||||||||||
|
Tax impact of operating income reconciling items at effective tax rate
|
(56,582 | ) | 9,891 | 742 | (4,008 | ) | (2,098 | ) | 535 |
nm
|
nm
|
(46,690 | ) | (1,563 | ) |
nm
|
nm
|
|||||||||||||||||||||||||||||||
|
Total net operating income reconciling items
|
105,131 | (15,191 | ) | (1,319 | ) | 7,672 | 3,838 | (976 | ) |
nm
|
nm
|
89,940 | 2,862 |
nm
|
nm
|
|||||||||||||||||||||||||||||||||
|
Net income
|
$ | 143,286 | $ | 22,008 | $ | 39,595 | $ | 52,889 | $ | 52,467 | $ | 44,023 | $ | 22,015 | 100.0 | % | $ | 165,294 | $ | 96,490 | $ | (68,804 | ) | -41.6 | % | |||||||||||||||||||||||
|
Segment Operating Results
|
PRIMERICA, INC.
|
| Financial Supplement |
|
YOY Q2
|
YOY YTD
|
|||||||||||||||||||||||||||||||||||||||||||||||
| (Dollars in thousands) |
Q1
2010
|
Q2
2010
|
Q3
2010
|
Q4
2010
|
Q1
2011
|
Q2
2011
|
$
Change
|
%
Change
|
YTD
2010
|
YTD
2011
|
$
Change
|
%
Change
|
||||||||||||||||||||||||||||||||||||
|
Term Life Insurance
|
||||||||||||||||||||||||||||||||||||||||||||||||
| Revenues: | ||||||||||||||||||||||||||||||||||||||||||||||||
|
Direct premiums
|
$ | 517,932 | $ | 527,792 | $ | 525,644 | $ | 529,341 | $ | 532,167 | $ | 540,283 | $ | 12,491 | 2.4 | % | $ | 1,045,724 | $ | 1,072,451 | $ | 26,727 | 2.6 | % | ||||||||||||||||||||||||
|
Ceded premiums
|
(440,699 | ) | (444,008 | ) | (433,234 | ) | (427,571 | ) | (427,382 | ) | (431,890 | ) | 12,118 | 2.7 | % | (884,707 | ) | (859,272 | ) | 25,435 | 2.9 | % | ||||||||||||||||||||||||||
|
Net premiums
|
77,233 | 83,784 | 92,410 | 101,770 | 104,786 | 108,393 | 24,609 | 29.4 | % | 161,017 | 213,179 | 52,162 | 32.4 | % | ||||||||||||||||||||||||||||||||||
|
Allocated net investment income
|
16,497 | 15,961 | 15,595 | 14,242 | 15,794 | 15,669 | (292 | ) | -1.8 | % | 32,458 | 31,463 | (995 | ) | -3.1 | % | ||||||||||||||||||||||||||||||||
|
Other, net
|
8,782 | 8,643 | 7,929 | 7,914 | 7,653 | 7,580 | (1,064 | ) | -12.3 | % | 17,425 | 15,233 | (2,192 | ) | -12.6 | % | ||||||||||||||||||||||||||||||||
|
Operating revenues
|
102,511 | 108,388 | 115,933 | 123,926 | 128,233 | 131,641 | 23,253 | 21.5 | % | 210,899 | 259,875 | 48,976 | 23.2 | % | ||||||||||||||||||||||||||||||||||
|
Benefits and expenses:
|
||||||||||||||||||||||||||||||||||||||||||||||||
|
Benefits and claims
|
32,905 | 35,134 | 39,084 | 42,325 | 47,351 | 43,921 | 8,787 | 25.0 | % | 68,039 | 91,271 | 23,233 | 34.1 | % | ||||||||||||||||||||||||||||||||||
|
Amortization of DAC
|
17,418 | 19,128 | 21,900 | 26,477 | 22,146 | 22,995 | 3,867 | 20.2 | % | 36,547 | 45,141 | 8,594 | 23.5 | % | ||||||||||||||||||||||||||||||||||
|
Insurance commissions
|
456 | 404 | 330 | 320 | 327 | 268 | (136 | ) | -33.7 | % | 860 | 594 | (265 | ) | -30.8 | % | ||||||||||||||||||||||||||||||||
|
Insurance expenses
|
8,687 | 6,824 | 9,194 | 13,095 | 6,618 | 15,804 | 8,980 | 131.6 | % | 15,511 | 22,422 | 6,911 | 44.6 | % | ||||||||||||||||||||||||||||||||||
|
Interest expense
|
2,812 | 2,803 | 2,843 | 2,851 | 2,872 | 2,873 | 70 | 2.5 | % | 5,615 | 5,745 | 129 | 2.3 | % | ||||||||||||||||||||||||||||||||||
|
Operating benefits and expenses
|
62,278 | 64,294 | 73,352 | 85,067 | 79,313 | 85,860 | 21,567 | 33.5 | % | 126,571 | 165,174 | 38,603 | 30.5 | % | ||||||||||||||||||||||||||||||||||
|
Operating income before income taxes
|
$ | 40,234 | $ | 44,095 | $ | 42,581 | $ | 38,859 | $ | 48,920 | $ | 45,781 | $ | 1,686 | 3.8 | % | $ | 84,328 | $ | 94,701 | $ | 10,373 | 12.3 | % | ||||||||||||||||||||||||
|
Investment & Savings Products
|
||||||||||||||||||||||||||||||||||||||||||||||||
| Revenues: | ||||||||||||||||||||||||||||||||||||||||||||||||
|
Commissions and fees:
|
||||||||||||||||||||||||||||||||||||||||||||||||
|
Sales-based
|
$ | 36,363 | $ | 36,301 | $ | 32,941 | $ | 37,001 | $ | 43,128 | $ | 44,904 | $ | 8,603 | 23.7 | % | $ | 72,664 | $ | 88,032 | $ | 15,368 | 21.1 | % | ||||||||||||||||||||||||
|
Asset-based
|
38,014 | 39,445 | 37,602 | 52,412 | 44,825 | 45,348 | 5,904 | 15.0 | % | 77,459 | 90,174 | 12,715 | 16.4 | % | ||||||||||||||||||||||||||||||||||
|
Account-based
|
10,208 | 10,317 | 10,620 | 10,545 | 10,432 | 11,811 | 1,493 | 14.5 | % | 20,526 | 22,242 | 1,717 | 8.4 | % | ||||||||||||||||||||||||||||||||||
| Other, net | 2,108 | 2,155 | 2,711 | 3,064 | 2,461 | 2,522 | 367 | 17.0 | % | 4,263 | 4,984 | 720 | 16.9 | % | ||||||||||||||||||||||||||||||||||
|
Operating revenues
|
86,693 | 88,218 | 83,874 | 103,021 | 100,846 | 104,586 | 16,367 | 18.6 | % | 174,911 | 205,432 | 30,520 | 17.4 | % | ||||||||||||||||||||||||||||||||||
|
Benefits and expenses:
|
||||||||||||||||||||||||||||||||||||||||||||||||
|
Amortization of DAC
|
2,549 | 3,029 | 1,361 | 2,392 | 2,785 | 3,751 | 722 | 23.8 | % | 5,578 | 6,535 | 958 | 17.2 | % | ||||||||||||||||||||||||||||||||||
|
Insurance commissions
|
1,809 | 1,989 | 1,964 | 2,091 | 2,140 | 2,344 | 355 | 17.9 | % | 3,798 | 4,484 | 687 | 18.1 | % | ||||||||||||||||||||||||||||||||||
|
Sales commissions:
|
#DIV/0!
|
#DIV/0!
|
||||||||||||||||||||||||||||||||||||||||||||||
|
Sales-based
|
26,203 | 25,998 | 23,474 | 25,319 | 30,547 | 31,378 | 5,381 | 20.7 | % | 52,201 | 61,925 | 9,725 | 18.6 | % | ||||||||||||||||||||||||||||||||||
|
Asset-based
|
12,715 | 12,911 | 12,232 | 20,271 | 15,451 | 15,111 | 2,200 | 17.0 | % | 25,626 | 30,562 | 4,936 | 19.3 | % | ||||||||||||||||||||||||||||||||||
|
Other operating expenses
|
17,970 | 17,556 | 18,266 | 18,179 | 18,884 | 21,531 | 3,974 | 22.6 | % | 35,527 | 40,415 | 4,888 | 13.8 | % | ||||||||||||||||||||||||||||||||||
|
Operating benefits and expenses
|
61,246 | 61,483 | 57,296 | 68,253 | 69,807 | 74,115 | 12,632 | 20.5 | % | 122,729 | 143,922 | 21,193 | 17.3 | % | ||||||||||||||||||||||||||||||||||
|
Operating income before income taxes
|
$ | 25,447 | $ | 26,735 | $ | 26,578 | $ | 34,769 | $ | 31,039 | $ | 30,470 | $ | 3,735 | 14.0 | % | $ | 52,182 | $ | 61,509 | $ | 9,327 | 17.9 | % | ||||||||||||||||||||||||
|
Corporate & Other Distributed Products
|
||||||||||||||||||||||||||||||||||||||||||||||||
| Revenues: | ||||||||||||||||||||||||||||||||||||||||||||||||
|
Direct premiums
|
$ | 19,913 | $ | 19,663 | $ | 21,800 | $ | 18,989 | $ | 19,902 | $ | 20,597 | $ | 934 | 4.8 | % | $ | 39,577 | $ | 40,499 | $ | 923 | 2.3 | % | ||||||||||||||||||||||||
|
Ceded premiums
|
(3,748 | ) | (3,206 | ) | (3,820 | ) | (3,551 | ) | (3,585 | ) | (3,674 | ) | (468 | ) | -14.6 | % | (6,954 | ) | (7,259 | ) | (305 | ) | -4.4 | % | ||||||||||||||||||||||||
|
Net premiums
|
16,165 | 16,458 | 17,980 | 15,438 | 16,317 | 16,924 | 466 | 2.8 | % | 32,623 | 33,240 | 618 | 1.9 | % | ||||||||||||||||||||||||||||||||||
|
Allocated net investment income
|
11,344 | 12,030 | 12,260 | 12,446 | 12,831 | 11,560 | (470 | ) | -3.9 | % | 23,374 | 24,392 | 1,018 | 4.4 | % | |||||||||||||||||||||||||||||||||
|
Commissions and fees:
|
||||||||||||||||||||||||||||||||||||||||||||||||
|
Loans
|
2,455 | 1,918 | 3,527 | 2,427 | 1,528 | 1,202 | (716 | ) | -37.3 | % | 4,373 | 2,730 | (1,644 | ) | -37.6 | % | ||||||||||||||||||||||||||||||||
|
DebtWatchers
|
620 | 779 | 845 | 1,035 | 1,071 | 805 | 26 |
nm
|
1,399 | 1,876 | 477 |
nm
|
||||||||||||||||||||||||||||||||||||
|
Prepaid Legal Services
|
2,340 | 2,305 | 2,287 | 2,689 | 2,619 | 2,345 | 39 | 1.7 | % | 4,645 | 4,964 | 319 | 6.9 | % | ||||||||||||||||||||||||||||||||||
|
Auto and Homeowners Insurance
|
1,012 | 1,372 | 1,200 | 1,395 | 1,687 | 1,507 | 135 | 9.8 | % | 2,384 | 3,194 | 810 | 34.0 | % | ||||||||||||||||||||||||||||||||||
|
Long-Term Care Insurance
|
679 | 788 | 715 | 784 | 825 | 775 | (12 | ) | -1.6 | % | 1,466 | 1,601 | 134 | 9.2 | % | |||||||||||||||||||||||||||||||||
|
Other, net
|
1,004 | 1,668 | 1,600 | 1,383 | 1,338 | 1,714 | 47 | 2.8 | % | 2,671 | 3,052 | 381 | 14.3 | % | ||||||||||||||||||||||||||||||||||
|
Operating revenues
|
35,618 | 37,318 | 40,414 | 37,598 | 38,216 | 36,832 | (485 | ) | -1.3 | % | 72,935 | 75,048 | 2,113 | 2.9 | % | |||||||||||||||||||||||||||||||||
|
Benefits and expenses:
|
||||||||||||||||||||||||||||||||||||||||||||||||
|
Benefits and claims
|
9,626 | 9,991 | 10,727 | 9,708 | 10,284 | 13,352 | 3,361 | 33.6 | % | 19,617 | 23,636 | 4,019 | 20.5 | % | ||||||||||||||||||||||||||||||||||
|
Amortization of DAC
|
400 | 742 | 583 | 667 | 625 | 639 | (104 | ) | -14.0 | % | 1,142 | 1,264 | 122 | 10.7 | % | |||||||||||||||||||||||||||||||||
|
Insurance commissions
|
2,438 | 1,838 | 2,804 | 1,793 | 2,534 | 1,607 | (231 | ) | -12.6 | % | 4,276 | 4,141 | (136 | ) | -3.2 | % | ||||||||||||||||||||||||||||||||
|
Insurance expenses
|
2,759 | 3,259 | 2,804 | 2,792 | 2,934 | 3,350 | 91 | 2.8 | % | 6,018 | 6,284 | 265 | 4.4 | % | ||||||||||||||||||||||||||||||||||
|
Sales commissions
|
4,963 | 4,603 | 6,560 | 4,676 | 4,358 | 3,674 | (929 | ) | -20.2 | % | 9,566 | 8,032 | (1,534 | ) | -16.0 | % | ||||||||||||||||||||||||||||||||
|
Interest expense
|
4,125 | 4,125 | 4,125 | 4,125 | 4,125 | 4,125 | — |
nm
|
8,250 | 8,250 | — |
nm
|
||||||||||||||||||||||||||||||||||||
|
Other operating expenses
|
18,298 | 22,170 | 18,030 | 18,622 | 18,107 | 16,667 | (5,503 | ) | -24.8 | % | 40,467 | 34,773 | (5,694 | ) | -14.1 | % | ||||||||||||||||||||||||||||||||
|
Operating benefits and expenses
|
42,609 | 46,727 | 45,633 | 42,383 | 42,967 | 43,413 | (3,314 | ) | -7.1 | % | 89,337 | 86,380 | (2,957 | ) | -3.3 | % | ||||||||||||||||||||||||||||||||
|
Operating income before income taxes
|
$ | (6,992 | ) | $ | (9,410 | ) | $ | (5,219 | ) | $ | (4,786 | ) | $ | (4,751 | ) | $ | (6,581 | ) | $ | 2,829 | 30.1 | % | $ | (16,402 | ) | $ | (11,331 | ) | $ | 5,070 | 30.9 | % | ||||||||||||||||
|
Term Life Insurance - Financial Results
|
|
PRIMERICA, INC.
|
| Financial Supplement |
|
YOY Q2
|
YOY YTD
|
|||||||||||||||||||||||||||||||||||||||||||||||
|
(Dollars in thousands)
|
Q1
2010
|
Q2
2010
|
Q3
2010
|
Q4
2010
|
Q1
2011
|
Q2
2011
|
$
Change
|
%
Change
|
YTD
2010
|
YTD
2011
|
$
Change
|
%
Change
|
||||||||||||||||||||||||||||||||||||
|
Term Life Insurance Operating Income Before Income Taxes
|
||||||||||||||||||||||||||||||||||||||||||||||||
|
Revenues:
|
||||||||||||||||||||||||||||||||||||||||||||||||
|
Direct premiums
|
$ | 517,932 | $ | 527,792 | $ | 525,644 | $ | 529,341 | $ | 532,167 | $ | 540,283 | $ | 12,491 | 2.4 | % | $ | 1,045,724 | $ | 1,072,451 | $ | 26,727 | 2.6 | % | ||||||||||||||||||||||||
|
Ceded premiums
|
(440,699 | ) | (444,008 | ) | (433,234 | ) | (427,571 | ) | (427,382 | ) | (431,890 | ) | 12,118 | 2.7 | % | (884,707 | ) | (859,272 | ) | 25,435 | 2.9 | % | ||||||||||||||||||||||||||
|
Net premiums
|
77,233 | 83,784 | 92,410 | 101,770 | 104,786 | 108,393 | 24,609 | 29.4 | % | 161,017 | 213,179 | 52,162 | 32.4 | % | ||||||||||||||||||||||||||||||||||
|
Allocated net investment income
|
16,497 | 15,961 | 15,595 | 14,242 | 15,794 | 15,669 | (292 | ) | -1.8 | % | 32,458 | 31,463 | (995 | ) | -3.1 | % | ||||||||||||||||||||||||||||||||
|
Other, net
|
8,782 | 8,643 | 7,929 | 7,914 | 7,653 | 7,580 | (1,064 | ) | -12.3 | % | 17,425 | 15,233 | (2,192 | ) | -12.6 | % | ||||||||||||||||||||||||||||||||
|
Operating revenues
|
102,511 | 108,388 | 115,933 | 123,926 | 128,233 | 131,641 | 23,253 | 21.5 | % | 210,899 | 259,875 | 48,976 | 23.2 | % | ||||||||||||||||||||||||||||||||||
|
Benefits and expenses:
|
||||||||||||||||||||||||||||||||||||||||||||||||
|
Benefits and claims
|
32,905 | 35,134 | 39,084 | 42,325 | 47,351 | 43,921 | 8,787 | 25.0 | % | 68,039 | 91,271 | 23,233 | 34.1 | % | ||||||||||||||||||||||||||||||||||
|
Amortization of DAC
|
17,418 | 19,128 | 21,900 | 26,477 | 22,146 | 22,995 | 3,867 | 20.2 | % | 36,547 | 45,141 | 8,594 | 23.5 | % | ||||||||||||||||||||||||||||||||||
|
Insurance commissions
|
456 | 404 | 330 | 320 | 327 | 268 | (136 | ) | -33.7 | % | 860 | 594 | (265 | ) | -30.8 | % | ||||||||||||||||||||||||||||||||
|
Insurance expenses
|
8,687 | 6,824 | 9,194 | 13,095 | 6,618 | 15,804 | 8,980 | 131.6 | % | 15,511 | 22,422 | 6,911 | 44.6 | % | ||||||||||||||||||||||||||||||||||
|
Interest expense
|
2,812 | 2,803 | 2,843 | 2,851 | 2,872 | 2,873 | 70 | 2.5 | % | 5,615 | 5,745 | 129 | 2.3 | % | ||||||||||||||||||||||||||||||||||
|
Operating benefits and expenses
|
62,278 | 64,294 | 73,352 | 85,067 | 79,313 | 85,860 | 21,567 | 33.5 | % | 126,571 | 165,174 | 38,603 | 30.5 | % | ||||||||||||||||||||||||||||||||||
|
Operating income before income taxes
|
$ | 40,234 | $ | 44,095 | $ | 42,581 | $ | 38,859 | $ | 48,920 | $ | 45,781 | $ | 1,686 | 3.8 | % | $ | 84,328 | $ | 94,701 | $ | 10,373 | 12.3 | % | ||||||||||||||||||||||||
|
New Term Life Insurance Operating Income Before Income Taxes (1)
|
||||||||||||||||||||||||||||||||||||||||||||||||
|
Revenues:
|
||||||||||||||||||||||||||||||||||||||||||||||||
|
Direct premiums
|
$ | 10,138 | $ | 21,256 | $ | 30,149 | $ | 38,197 | $ | 46,771 | $ | 56,581 | $ | 35,325 |
nm
|
$ | 31,394 | $ | 103,352 | $ | 71,958 |
nm
|
||||||||||||||||||||||||||
|
Ceded premiums
|
(3,737 | ) | (3,869 | ) | (3,351 | ) | (4,029 | ) | (8,075 | ) | (9,320 | ) | (5,451 | ) | -140.9 | % | (7,605 | ) | (17,395 | ) | (9,789 | ) | -128.7 | % | ||||||||||||||||||||||||
|
Net premiums
|
6,401 | 17,388 | 26,799 | 34,168 | 38,697 | 47,261 | 29,873 |
nm
|
23,789 | 85,957 | 62,169 |
nm
|
||||||||||||||||||||||||||||||||||||
|
Allocated net investment income
|
109 | 175 | 318 | 478 | 630 | 722 | 547 |
nm
|
284 | 1,352 | 1,068 |
nm
|
||||||||||||||||||||||||||||||||||||
|
Other, net
|
8,802 | 8,675 | 8,100 | 7,890 | 7,614 | 7,605 | (1,070 | ) | -12.3 | % | 17,477 | 15,219 | (2,257 | ) | -12.9 | % | ||||||||||||||||||||||||||||||||
|
Operating revenues
|
15,312 | 26,238 | 35,216 | 42,537 | 46,941 | 55,588 | 29,351 | 111.9 | % | 41,549 | 102,529 | 60,980 | 146.8 | % | ||||||||||||||||||||||||||||||||||
|
Benefits and expenses:
|
||||||||||||||||||||||||||||||||||||||||||||||||
|
Benefits and claims
|
1,517 | 5,413 | 10,343 | 13,550 | 14,002 | 17,380 | 11,967 |
nm
|
6,931 | 31,382 | 24,451 |
nm
|
||||||||||||||||||||||||||||||||||||
|
Amortization of DAC
|
968 | 6,405 | 7,725 | 11,667 | 10,163 | 10,527 | 4,122 | 64.4 | % | 7,373 | 20,691 | 13,317 |
nm
|
|||||||||||||||||||||||||||||||||||
|
Insurance commissions
|
— | 0 | (1 | ) | (0 | ) | (0 | ) | (0 | ) | (0 | ) |
nm
|
0 | (0 | ) | (0 | ) |
nm
|
|||||||||||||||||||||||||||||
|
Insurance expenses
|
18,180 | 16,050 | 18,224 | 19,128 | 15,761 | 24,550 | 8,500 | 53.0 | % | 34,230 | 40,310 | 6,080 | 17.8 | % | ||||||||||||||||||||||||||||||||||
|
Interest expense
|
— | (0 | ) | — | — | — | — | 0 | 100.0 | % | (0 | ) | — | 0 | 100.0 | % | ||||||||||||||||||||||||||||||||
|
Operating benefits and expenses
|
20,665 | 27,869 | 36,291 | 44,344 | 39,926 | 52,457 | 24,588 | 88.2 | % | 48,534 | 92,383 | 43,849 | 90.3 | % | ||||||||||||||||||||||||||||||||||
|
Operating income before income taxes
|
$ | (5,354 | ) | $ | (1,631 | ) | $ | (1,075 | ) | $ | (1,807 | ) | $ | 7,015 | $ | 3,132 | $ | 4,762 |
nm
|
$ | (6,984 | ) | $ | 10,147 | $ | 17,131 |
nm
|
|||||||||||||||||||||
|
Legacy Term Life Insurance Operating Income Before Income Taxes (2)
|
||||||||||||||||||||||||||||||||||||||||||||||||
|
Revenues:
|
||||||||||||||||||||||||||||||||||||||||||||||||
|
Direct premiums
|
$ | 507,794 | $ | 506,536 | $ | 495,494 | $ | 491,144 | $ | 485,396 | $ | 483,702 | $ | (22,834 | ) | -4.5 | % | $ | 1,014,329 | $ | 969,098 | $ | (45,231 | ) | -4.5 | % | ||||||||||||||||||||||
|
Ceded premiums
|
(436,962 | ) | (440,140 | ) | (429,883 | ) | (423,542 | ) | (419,307 | ) | (422,570 | ) | 17,569 | 4.0 | % | (877,101 | ) | (841,877 | ) | 35,225 | 4.0 | % | ||||||||||||||||||||||||||
|
Net premiums
|
70,832 | 66,396 | 65,611 | 67,602 | 66,089 | 61,132 | (5,264 | ) | -7.9 | % | 137,228 | 127,222 | (10,006 | ) | -7.3 | % | ||||||||||||||||||||||||||||||||
|
Allocated net investment income
|
16,388 | 15,786 | 15,277 | 13,763 | 15,164 | 14,947 | (839 | ) | -5.3 | % | 32,174 | 30,111 | (2,063 | ) | -6.4 | % | ||||||||||||||||||||||||||||||||
|
Other, net
|
(20 | ) | (32 | ) | (170 | ) | 24 | 39 | (26 | ) | 6 | 18.7 | % | (52 | ) | 14 | 66 | 125.9 | % | |||||||||||||||||||||||||||||
|
Operating revenues
|
87,199 | 82,150 | 80,718 | 81,389 | 81,293 | 76,053 | (6,098 | ) | -7.4 | % | 169,350 | 157,346 | (12,004 | ) | -7.1 | % | ||||||||||||||||||||||||||||||||
|
Benefits and expenses:
|
||||||||||||||||||||||||||||||||||||||||||||||||
|
Benefits and claims
|
31,388 | 29,721 | 28,741 | 28,775 | 33,349 | 26,541 | (3,180 | ) | -10.7 | % | 61,108 | 59,890 | (1,219 | ) | -2.0 | % | ||||||||||||||||||||||||||||||||
|
Amortization of DAC
|
16,450 | 12,723 | 14,175 | 14,810 | 11,983 | 12,468 | (255 | ) | -2.0 | % | 29,173 | 24,451 | (4,723 | ) | -16.2 | % | ||||||||||||||||||||||||||||||||
|
Insurance commissions
|
456 | 404 | 331 | 320 | 327 | 268 | (136 | ) | -33.7 | % | 860 | 595 | (265 | ) | -30.8 | % | ||||||||||||||||||||||||||||||||
|
Insurance expenses
|
10,047 | 9,888 | 9,648 | 12,270 | 9,366 | 9,466 | (422 | ) | -4.3 | % | 19,936 | 18,831 | (1,104 | ) | -5.5 | % | ||||||||||||||||||||||||||||||||
|
Insurance expense allowance
|
(19,541 | ) | (19,114 | ) | (18,678 | ) | (18,303 | ) | (18,508 | ) | (18,212 | ) | 902 | 4.7 | % | (38,655 | ) | (36,720 | ) | 1,935 | 5.0 | % | ||||||||||||||||||||||||||
|
Interest expense
|
2,812 | 2,803 | 2,843 | 2,851 | 2,872 | 2,873 | 70 | 2.5 | % | 5,615 | 5,745 | 129 | 2.3 | % | ||||||||||||||||||||||||||||||||||
|
Operating benefits and expenses
|
41,612 | 36,425 | 37,061 | 40,723 | 39,387 | 33,403 | (3,022 | ) | -8.3 | % | 78,037 | 72,791 | (5,246 | ) | -6.7 | % | ||||||||||||||||||||||||||||||||
|
Operating income before income taxes
|
$ | 45,587 | $ | 45,726 | $ | 43,657 | $ | 40,666 | $ | 41,905 | $ | 42,649 | $ | (3,076 | ) | -6.7 | % | $ | 91,313 | $ | 84,555 | $ | (6,758 | ) | -7.4 | % | ||||||||||||||||||||||
| (1 | ) |
Represents results associated with business written subsequent to the Citi reinsurance transactions executed on March 31, 2010.
|
| (2 | ) |
Represents results associated with business subject to the Citi reinsurance transactions.
|
|
Term Life Insurance - Key Statistics and Financial Analysis
|
PRIMERICA, INC.
|
| Financial Supplement |
|
YOY Q2
|
YOY YTD
|
|||||||||||||||||||||||||||||||||||||||||||||||
|
(Dollars in thousands, except as noted)
|
Q1
2010
|
Q2
2010
|
Q3
2010
|
Q4
2010
|
Q1
2011
|
Q2
2011
|
$
Change
|
%
Change
|
YTD
2010
|
YTD
2011
|
$
Change
|
%
Change
|
||||||||||||||||||||||||||||||||||||
|
Key Statistics
|
||||||||||||||||||||||||||||||||||||||||||||||||
|
Life-insurance licensed sales force, beginning of period
|
99,785 | 97,354 | 96,066 | 96,872 | 94,850 | 92,212 | (5,142 | ) | -5.3 | % | 99,785 | 94,850 | (4,935 | ) | -4.9 | % | ||||||||||||||||||||||||||||||||
|
New life-licensed representatives
|
7,366 | 9,887 | 9,430 | 7,805 | 7,145 | 8,061 | (1,826 | ) | -18.5 | % | 17,253 | 15,206 | (2,047 | ) | -11.9 | % | ||||||||||||||||||||||||||||||||
|
Non-renewal and terminated representatives
|
(9,797 | ) | (11,175 | ) | (8,624 | ) | (9,827 | ) | (9,783 | ) | (9,754 | ) | 1,421 | 12.7 | % | (20,972 | ) | (19,537 | ) | 1,435 | 6.8 | % | ||||||||||||||||||||||||||
|
Life-insurance licensed sales force, end of period
|
97,354 | 96,066 | 96,872 | 94,850 | 92,212 | 90,519 | (5,547 | ) | -5.8 | % | 96,066 | 90,519 | (5,547 | ) | -5.8 | % | ||||||||||||||||||||||||||||||||
|
Estimated annualized issued term life premium ($mills) (1):
|
||||||||||||||||||||||||||||||||||||||||||||||||
|
Premium from new policies
|
$ | 43.4 | $ | 48.9 | $ | 44.1 | $ | 44.5 | $ | 41.1 | $ | 47.5 | $ | (1.4 | ) | -2.9 | % | $ | 92.2 | $ | 88.6 | $ | (3.6 | ) | -3.9 | % | ||||||||||||||||||||||
|
Additions and increases in premium
|
10.8 | 11.7 | 10.9 | 11.2 | 10.4 | 11.4 | (0.3 | ) | -2.2 | % | 22.5 | 21.8 | (0.7 | ) | -3.0 | % | ||||||||||||||||||||||||||||||||
|
Total estimated annualized issued term life premium
|
$ | 54.2 | $ | 60.6 | $ | 55.0 | $ | 55.6 | $ | 51.5 | $ | 58.9 | $ | (1.7 | ) | -2.7 | % | $ | 114.7 | $ | 110.4 | $ | (4.3 | ) | -3.7 | % | ||||||||||||||||||||||
|
Issued term life policies
|
52,445 | 60,406 | 54,373 | 56,290 | 51,281 | 59,826 | (580 | ) |
nm
|
112,851 | 111,107 | (1,744 | ) | -1.5 | % | |||||||||||||||||||||||||||||||||
|
Estimated average annualized issued term life premium per policy (1)(2)
|
$ | 827 | $ | 809 | $ | 811 | $ | 790 | $ | 802 | $ | 794 | $ | (15 | ) | -1.9 | % | $ | 817 | $ | 797 | $ | (20 | ) | -2.4 | % | ||||||||||||||||||||||
|
Term life face amount in-force, beginning of period ($mills)
|
$ | 650,195 | $ | 651,790 | $ | 653,530 | $ | 654,633 | $ | 656,791 | $ | 658,523 | $ | 6,734 | 1.0 | % | $ | 650,195 | $ | 656,791 | $ | 6,596 | 1.0 | % | ||||||||||||||||||||||||
|
Issued term life face amount (3)
|
17,997 | 20,042 | 18,113 | 18,250 | 16,735 | 18,974 | (1,068 | ) | -5.3 | % | 38,038 | 35,709 | (2,330 | ) | -6.1 | % | ||||||||||||||||||||||||||||||||
|
Terminated term life face amount
|
(18,867 | ) | (16,156 | ) | (17,836 | ) | (18,105 | ) | (17,247 | ) | (14,724 | ) | 1,432 | 8.9 | % | (35,023 | ) | (31,971 | ) | 3,052 | 8.7 | % | ||||||||||||||||||||||||||
|
Foreign currency impact, net
|
2,464 | (2,146 | ) | 826 | 2,013 | 2,244 | 843 | 2,989 |
nm
|
318 | 3,087 | 2,769 |
nm
|
|||||||||||||||||||||||||||||||||||
|
Term life face amount in-force, end of period
|
$ | 651,790 | $ | 653,530 | $ | 654,633 | $ | 656,791 | $ | 658,523 | $ | 663,617 | $ | 10,087 | 1.5 | % | $ | 653,530 | $ | 663,617 | $ | 10,087 | 1.5 | % | ||||||||||||||||||||||||
|
New Term Life Insurance - Financial Analysis
|
||||||||||||||||||||||||||||||||||||||||||||||||
|
Direct premium
|
$ | 10,138 | $ | 21,256 | $ | 30,149 | $ | 38,197 | $ | 46,771 | $ | 56,581 | 35,325 |
nm
|
$ | 31,394 | $ | 103,352 | $ | 71,958 |
nm
|
|||||||||||||||||||||||||||
|
New term life operating income before income taxes
|
$ | (5,354 | ) | $ | (1,631 | ) | $ | (1,075 | ) | $ | (1,807 | ) | $ | 7,015 | $ | 3,132 | 4,762 |
nm
|
$ | (6,984 | ) | $ | 10,147 | $ | 17,131 |
nm
|
||||||||||||||||||||||
|
% of direct premium
|
-52.8 | % | -7.7 | % | -3.6 | % | -4.7 | % | 15.0 | % | 5.5 | % |
nm
|
nm
|
-22.2 | % | 9.8 | % |
nm
|
nm
|
||||||||||||||||||||||||||||
|
Benefits & expenses, net (4)
|
$ | 6,222 | $ | 15,687 | $ | 21,418 | $ | 29,245 | $ | 32,240 | $ | 37,227 | 21,540 | 137.3 | % | $ | 21,909 | $ | 69,467 | $ | 47,558 |
nm
|
||||||||||||||||||||||||||
|
% of direct premium
|
61.4 | % | 73.8 | % | 71.0 | % | 76.6 | % | 68.9 | % | 65.8 | % |
nm
|
nm
|
69.8 | % | 67.2 | % |
nm
|
nm
|
||||||||||||||||||||||||||||
|
Insurance expenses, net (5)
|
$ | 9,378 | $ | 7,375 | $ | 10,124 | $ | 11,237 | $ | 8,147 | $ | 16,944 | 9,569 | 129.8 | % | $ | 16,753 | $ | 25,091 | $ | 8,338 | 49.8 | % | |||||||||||||||||||||||||
|
% of direct premium
|
92.5 | % | 34.7 | % | 33.6 | % | 29.4 | % | 17.4 | % | 29.9 | % |
nm
|
nm
|
53.4 | % | 24.3 | % |
nm
|
nm
|
||||||||||||||||||||||||||||
|
Legacy Term Life Insurance - Financial Analysis
|
||||||||||||||||||||||||||||||||||||||||||||||||
|
Direct premium
|
$ | 507,794 | $ | 506,536 | $ | 495,494 | $ | 491,144 | $ | 485,396 | $ | 483,702 | (22,834 | ) | -4.5 | % | $ | 1,014,329 | $ | 969,098 | $ | (45,231 | ) | -4.5 | % | |||||||||||||||||||||||
|
Legacy term life operating income before income taxes
|
$ | 45,587 | $ | 45,726 | $ | 43,657 | $ | 40,666 | $ | 41,905 | $ | 42,649 | (3,076 | ) | -6.7 | % | $ | 91,313 | $ | 84,555 | $ | (6,758 | ) | -7.4 | % | |||||||||||||||||||||||
|
% of direct premium
|
9.0 | % | 9.0 | % | 8.8 | % | 8.3 | % | 8.6 | % | 8.8 | % |
nm
|
nm
|
9.0 | % | 8.7 | % |
nm
|
nm
|
||||||||||||||||||||||||||||
| (1 | ) |
Estimated annualized issued term life premium - estimated as average premium per $1,000 of face amounts issued on new policies and additions (before free look returns) multiplied by actual face amount issued on new policies, rider additions and face amount increases.
|
| (2 | ) |
In whole dollars
|
| (3 | ) |
Issued term life face amount - includes face amount on issued term life policies, additional riders added to existing policies, and face increases under increasing benefit riders
|
| (4 | ) |
Benefits & expenses, net - includes total benefits & claims, ceded premiums, insurance commissions, and amortization of deferred policy acquisition costs
|
| (5 | ) |
Insurance expenses, net - insurance expenses, net of other net revenues
|
|
Investment and Savings Products - Financial Results, Key Statistics, and Financial Analysis
|
PRIMERICA, INC.
|
| Financial Supplement |
|
(Dollars in thousands, except as noted)
|
YOY Q2
|
YOY YTD
|
||||||||||||||||||||||||||||||||||||||||||||||
|
Investment & Savings Products Operating Income Before Income Taxes
|
Q1
2010
|
Q2
2010
|
Q3
2010
|
Q4
2010
|
Q1
2011
|
Q2
2011
|
$
Change
|
%
Change
|
YTD
2010
|
YTD
2011
|
$
Change
|
%
Change
|
||||||||||||||||||||||||||||||||||||
|
Revenues:
|
||||||||||||||||||||||||||||||||||||||||||||||||
|
Commissions and fees:
|
||||||||||||||||||||||||||||||||||||||||||||||||
|
Sales-based
|
$ | 36,363 | $ | 36,301 | $ | 32,941 | $ | 37,001 | $ | 43,128 | $ | 44,904 | $ | 8,603 | 23.7 | % | $ | 72,664 | $ | 88,032 | $ | 15,368 | 21.1 | % | ||||||||||||||||||||||||
|
Asset-based
|
38,014 | 39,445 | 37,602 | 52,412 | 44,825 | 45,348 | 5,904 | 15.0 | % | 77,459 | 90,174 | 12,715 | 16.4 | % | ||||||||||||||||||||||||||||||||||
|
Account-based
|
10,208 | 10,317 | 10,620 | 10,545 | 10,432 | 11,811 | 1,493 | 14.5 | % | 20,526 | 22,242 | 1,717 | 8.4 | % | ||||||||||||||||||||||||||||||||||
|
Other, net
|
2,108 | 2,155 | 2,711 | 3,064 | 2,461 | 2,522 | 367 | 17.0 | % | 4,263 | 4,984 | 720 | 16.9 | % | ||||||||||||||||||||||||||||||||||
|
Operating revenues
|
86,693 | 88,218 | 83,874 | 103,021 | 100,846 | 104,586 | 16,367 | 18.6 | % | 174,911 | 205,432 | 30,520 | 17.4 | % | ||||||||||||||||||||||||||||||||||
|
Benefits and expenses:
|
||||||||||||||||||||||||||||||||||||||||||||||||
|
Amortization of DAC
|
2,549 | 3,029 | 1,361 | 2,392 | 2,785 | 3,751 | 722 | 23.8 | % | 5,578 | 6,535 | 958 | 17.2 | % | ||||||||||||||||||||||||||||||||||
|
Insurance commissions
|
1,809 | 1,989 | 1,964 | 2,091 | 2,140 | 2,344 | 355 | 17.9 | % | 3,798 | 4,484 | 687 | 18.1 | % | ||||||||||||||||||||||||||||||||||
|
Sales commissions:
|
||||||||||||||||||||||||||||||||||||||||||||||||
|
Sales-based
|
26,203 | 25,998 | 23,474 | 25,319 | 30,547 | 31,378 | 5,381 | 20.7 | % | 52,201 | 61,925 | 9,725 | 18.6 | % | ||||||||||||||||||||||||||||||||||
|
Asset-based
|
12,715 | 12,911 | 12,232 | 20,271 | 15,451 | 15,111 | 2,200 | 17.0 | % | 25,626 | 30,562 | 4,936 | 19.3 | % | ||||||||||||||||||||||||||||||||||
|
Other operating expenses
|
17,970 | 17,556 | 18,266 | 18,179 | 18,884 | 21,531 | 3,974 | 22.6 | % | 35,527 | 40,415 | 4,888 | 13.8 | % | ||||||||||||||||||||||||||||||||||
|
Operating benefits and expenses
|
61,246 | 61,483 | 57,296 | 68,253 | 69,807 | 74,115 | 12,632 | 20.5 | % | 122,729 | 143,922 | 21,193 | 17.3 | % | ||||||||||||||||||||||||||||||||||
|
Operating income before income taxes
|
$ | 25,447 | $ | 26,735 | $ | 26,578 | $ | 34,769 | $ | 31,039 | $ | 30,470 | $ | 3,735 | 14.0 | % | $ | 52,182 | $ | 61,509 | $ | 9,327 | 17.9 | % | ||||||||||||||||||||||||
|
Key Statistics
|
||||||||||||||||||||||||||||||||||||||||||||||||
|
Product sales ($mills)
|
||||||||||||||||||||||||||||||||||||||||||||||||
|
Retail Mutual Funds
|
$ | 594.7 | $ | 551.0 | $ | 474.8 | $ | 520.3 | $ | 646.0 | $ | 603.1 | $ | 52.1 | 9.5 | % | $ | 1,145.7 | $ | 1,249.1 | $ | 103.4 | 9.0 | % | ||||||||||||||||||||||||
|
Variable Annuities and other
|
267.3 | 308.3 | 287.5 | 306.1 | 344.6 | 458.0 | 149.7 | 48.6 | % | 575.7 | 802.6 | 227.0 | 39.4 | % | ||||||||||||||||||||||||||||||||||
|
Total sales-based revenue generating product sales
|
862.1 | 859.3 | 762.3 | 826.4 | 990.6 | 1,061.1 | 201.8 | 23.5 | % | 1,721.4 | 2,051.7 | 330.3 | 19.2 | % | ||||||||||||||||||||||||||||||||||
|
Managed Mutual Funds
|
— | — | — | — | — | 0.2 | 0.2 |
nm
|
— | 0.2 | 0.2 |
nm
|
||||||||||||||||||||||||||||||||||||
|
Segregated Funds
|
111.4 | 64.0 | 61.6 | 76.6 | 123.1 | 74.2 | 10.2 | 15.9 | % | 175.4 | 197.2 | 21.8 | 12.4 | % | ||||||||||||||||||||||||||||||||||
|
Total product sales
|
$ | 973.5 | $ | 923.3 | $ | 823.9 | $ | 903.0 | $ | 1,113.7 | $ | 1,135.5 | $ | 212.2 | 23.0 | % | $ | 1,896.8 | $ | 2,249.2 | $ | 352.3 | 18.6 | % | ||||||||||||||||||||||||
|
Client asset values, beginning of period ($mills)
|
$ | 31,303 | $ | 32,670 | $ | 29,723 | $ | 32,600 | $ | 34,869 | $ | 36,187 | $ | 3,517 | 10.8 | % | $ | 31,303 | $ | 34,869 | $ | 3,566 | 11.4 | % | ||||||||||||||||||||||||
|
Inflows
|
974 | 923 | 824 | 903 | 1,114 | 1,136 | 212 | 23.0 | % | 1,897 | 2,249 | 352 | 18.6 | % | ||||||||||||||||||||||||||||||||||
|
Outflows (1)
|
(956 | ) | (903 | ) | (887 | ) | (945 | ) | (1,083 | ) | (1,118 | ) | (215 | ) | -23.8 | % | (1,859 | ) | (2,201 | ) | (342 | ) | -18.4 | % | ||||||||||||||||||||||||
|
Net flows
|
17 | 20 | (63 | ) | (42 | ) | 31 | 18 | (3 | ) |
nm
|
37 | 48 | 11 |
nm
|
|||||||||||||||||||||||||||||||||
|
Change in market value, net and other (2)
|
1,350 | (2,967 | ) | 2,940 | 2,311 | 1,288 | (185 | ) | 2,782 |
nm
|
(1,618 | ) | 1,102 | 2,720 |
nm
|
|||||||||||||||||||||||||||||||||
|
Client asset values, end of period
|
$ | 32,670 | $ | 29,723 | $ | 32,600 | $ | 34,869 | $ | 36,187 | $ | 36,020 | $ | 6,297 | 21.2 | % | $ | 29,723 | $ | 36,020 | $ | 6,297 | 21.2 | % | ||||||||||||||||||||||||
|
Average client asset values ($mills)
|
||||||||||||||||||||||||||||||||||||||||||||||||
|
Mutual Funds
|
$ | 22,453 | $ | 22,424 | $ | 21,919 | $ | 23,661 | $ | 24,882 | $ | 25,330 | $ | 2,906 | 13.0 | % | $ | 22,439 | $ | 25,106 | $ | 2,668 | 11.9 | % | ||||||||||||||||||||||||
|
Variable Annuities and other
|
6,847 | 6,955 | 6,954 | 7,623 | 8,242 | 8,588 | 1,633 | 23.5 | % | 6,901 | 8,415 | 1,514 | 21.9 | % | ||||||||||||||||||||||||||||||||||
|
Segregated Funds
|
2,105 | 2,182 | 2,184 | 2,327 | 2,477 | 2,545 | 363 | 16.7 | % | 2,144 | 2,511 | 368 | 17.2 | % | ||||||||||||||||||||||||||||||||||
|
Total
|
$ | 31,404 | $ | 31,561 | $ | 31,056 | $ | 33,611 | $ | 35,602 | $ | 36,463 | $ | 4,902 | 15.5 | % | $ | 31,483 | $ | 36,033 | $ | 4,550 | 14.5 | % | ||||||||||||||||||||||||
|
Average number of fee-generating accounts (thous) (3)
|
2,762 | 2,741 | 2,715 | 2,694 | 2,662 | 2,611 | (131 | ) | -4.8 | % | 2,752 | 2,637 | (115 | ) | -4.2 | % | ||||||||||||||||||||||||||||||||
|
Financial Analysis
|
||||||||||||||||||||||||||||||||||||||||||||||||
|
Sales-based net revenue as % of sales (4)
|
1.18 | % | 1.20 | % | 1.24 | % | 1.41 | % | 1.27 | % | 1.27 | % |
nm
|
nm
|
1.19 | % | 1.27 | % |
nm
|
nm
|
||||||||||||||||||||||||||||
|
Asset-based net revenue as % of average asset values (5)
|
0.07 | % | 0.07 | % | 0.07 | % | 0.08 | % | 0.07 | % | 0.07 | % |
nm
|
nm
|
0.13 | % | 0.13 | % |
nm
|
nm
|
||||||||||||||||||||||||||||
|
Account-based revenue per average fee generating account (6)
|
$ | 3.70 | $ | 3.76 | $ | 3.91 | $ | 3.91 | $ | 3.92 | $ | 4.52 |
nm
|
nm
|
7.46 | 8.44 |
nm
|
nm
|
||||||||||||||||||||||||||||||
| (1 | ) |
Asset value outflows - include (a) redemptions of assets, (b) sales charges on the inflow sales figures, and (c) the net flow of money market funds sold and redeemed on the company's recordkeeping platform. The redemptions of assets must be estimated for approximately 9% of account values as these figures are not readily available. Actual redemptions as a percentage of account values for similar known account values are used to estimate the unknown redemption values.
|
| (2 | ) |
Change in market value, net - market value fluctuations net of fees, expenses, and foreign currency impact
|
| (3 | ) |
Fee generating accounts - mutual fund accounts for which we receive recording keeping and/or custodial fees
|
| (4 | ) |
Sales-based net revenue - commission and fee revenue less commissions paid to the sales force based on product sales activity
|
| (5 | ) |
Asset-based net revenue - commission and fee revenue less commissions paid to the sales force earned based on product account values including amortization of deferred acquisition costs for segregated funds
|
| (6 | ) |
In whole dollars
|
|
Investment Portfolio - Summary of Holdings
|
PRIMERICA, INC.
|
| Financial Supplement |
|
As of or for the period ended June 30, 2011
|
||||||||||||||||||||||||||||
|
% of Total
|
Avg
|
|||||||||||||||||||||||||||
|
Market
|
Amortized
|
Unrealized
|
Market
|
Amortized
|
Book
|
Avg
|
||||||||||||||||||||||
|
(Dollars in thousands)
|
Value
|
Cost
|
G/(L) |
Value
|
Cost
|
Yield
|
Rating
|
|||||||||||||||||||||
|
Investment Portfolio by Asset Class
|
||||||||||||||||||||||||||||
|
Cash and cash equivalents
|
$ | 114,051 | $ | 114,051 | $ | — | 5.0 | % | 5.4 | % | ||||||||||||||||||
|
Fixed Income:
|
||||||||||||||||||||||||||||
|
Treasury
|
33,406 | 29,358 | 4,048 | 1.5 | % | 1.4 | % | 3.37 | % |
AAA
|
||||||||||||||||||
|
Government
|
108,697 | 94,975 | 13,721 | 4.8 | % | 4.5 | % | 4.75 | % |
AA-
|
||||||||||||||||||
|
Tax-Exempt Municipal
|
7,104 | 6,674 | 430 | 0.3 | % | 0.3 | % | 3.80 | % |
AA
|
||||||||||||||||||
|
Corporate
|
1,330,592 | 1,220,284 | 110,308 | 58.6 | % | 58.1 | % | 5.64 | % |
BBB+
|
||||||||||||||||||
|
Mortgage-Backed
|
316,725 | 293,420 | 23,305 | 13.9 | % | 14.0 | % | 5.44 | % |
AA+
|
||||||||||||||||||
|
Asset-Backed
|
64,797 | 65,984 | (1,187 | ) | 2.9 | % | 3.1 | % | 1.66 | % |
AA-
|
|||||||||||||||||
|
CMBS
|
152,736 | 145,449 | 7,287 | 6.7 | % | 6.9 | % | 5.00 | % |
AAA
|
||||||||||||||||||
|
Private
|
109,913 | 103,515 | 6,398 | 4.8 | % | 4.9 | % | 6.09 | % |
BBB
|
||||||||||||||||||
|
Redeemable Preferred
|
539 | 691 | (152 | ) | 0.0 | % | 0.0 | % | 45.19 | % | A | |||||||||||||||||
|
Convertible
|
10,605 | 9,839 | 765 | 0.5 | % | 0.5 | % | 4.59 | % |
BBB
|
||||||||||||||||||
|
Total Fixed Income
|
2,135,113 | 1,970,189 | 164,924 | 94.0 | % | 93.8 | % | 5.38 | % | A | ||||||||||||||||||
|
OK
|
OK
|
|||||||||||||||||||||||||||
|
Equities:
|
||||||||||||||||||||||||||||
|
Perpetual Preferred
|
211 | 85 | 126 | 0.0 | % | 0.0 | % | |||||||||||||||||||||
|
Common Stock
|
11,228 | 8,567 | 2,662 | 0.5 | % | 0.4 | % | |||||||||||||||||||||
|
Mutual Fund
|
7,435 | 4,042 | 3,393 | 0.3 | % | 0.2 | % | |||||||||||||||||||||
|
Other
|
3,911 | 3,911 | — | 0.2 | % | 0.2 | % | |||||||||||||||||||||
|
Total Equities
|
22,786 | 16,605 | 6,181 | 1.0 | % | 0.8 | % | |||||||||||||||||||||
|
OK
|
OK
|
|||||||||||||||||||||||||||
|
Total Invested Assets
|
$ | 2,271,950 | $ | 2,100,845 | $ | 171,105 | 100.0 | % | 100.0 | % | ||||||||||||||||||
|
OK
|
||||||||||||||||||||||||||||
|
Corporate Portfolio by Sector
|
||||||||||||||||||||||||||||
|
Banking
|
$ | 140,441 | $ | 133,106 | $ | 7,335 | 10.6 | % | 10.9 | % | ||||||||||||||||||
|
Basic Industry
|
100,574 | 91,390 | 9,184 | 7.6 | % | 7.5 | % | |||||||||||||||||||||
|
Brokerage
|
20,381 | 18,363 | 2,017 | 1.5 | % | 1.5 | % | |||||||||||||||||||||
|
Capital Goods
|
82,685 | 75,716 | 6,970 | 6.2 | % | 6.2 | % | |||||||||||||||||||||
|
Communications
|
97,154 | 88,316 | 8,837 | 7.3 | % | 7.2 | % | |||||||||||||||||||||
|
Consumer Cyclical
|
60,856 | 55,314 | 5,541 | 4.6 | % | 4.5 | % | |||||||||||||||||||||
|
Consumer Non-Cyclical
|
153,518 | 138,691 | 14,827 | 11.5 | % | 11.4 | % | |||||||||||||||||||||
|
Electric
|
131,050 | 118,200 | 12,850 | 9.8 | % | 9.7 | % | |||||||||||||||||||||
|
Energy
|
78,274 | 70,667 | 7,608 | 5.9 | % | 5.8 | % | |||||||||||||||||||||
|
Finance Companies
|
35,300 | 30,948 | 4,353 | 2.7 | % | 2.5 | % | |||||||||||||||||||||
|
Financial Other
|
12,076 | 11,444 | 632 | 0.9 | % | 0.9 | % | |||||||||||||||||||||
|
Industrial Other
|
23,398 | 21,901 | 1,497 | 1.8 | % | 1.8 | % | |||||||||||||||||||||
|
Insurance
|
116,412 | 108,803 | 7,608 | 8.7 | % | 8.9 | % | |||||||||||||||||||||
|
Natural Gas
|
80,156 | 72,624 | 7,531 | 6.0 | % | 6.0 | % | |||||||||||||||||||||
|
REITs
|
107,418 | 100,845 | 6,573 | 8.1 | % | 8.3 | % | |||||||||||||||||||||
|
Technology
|
61,048 | 56,682 | 4,366 | 4.6 | % | 4.6 | % | |||||||||||||||||||||
|
Transportation
|
24,492 | 22,281 | 2,211 | 1.8 | % | 1.8 | % | |||||||||||||||||||||
|
Utility Other
|
5,361 | 4,994 | 367 | 0.4 | % | 0.4 | % | |||||||||||||||||||||
|
Total Corporate portfolio
|
$ | 1,330,592 | $ | 1,220,284 | $ | 110,308 | 100.0 | % | 100.0 | % | ||||||||||||||||||
|
OK
|
OK
|
|||||||||||||||||||||||||||
|
Fixed-Maturity Securities - Effective Maturity
|
||||||||||||||||||||||||||||
|
Effective maturity
|
||||||||||||||||||||||||||||
|
< 1 Yr.
|
$ | 238,475 | $ | 233,552 | $ | 4,924 | 11.2 | % | 11.9 | % | ||||||||||||||||||
|
1-2 Yrs.
|
219,108 | 206,994 | 12,114 | 10.3 | % | 10.5 | % | |||||||||||||||||||||
|
2-5 Yrs.
|
905,055 | 832,827 | 72,228 | 42.4 | % | 42.3 | % | |||||||||||||||||||||
|
5-10 Yrs.
|
710,358 | 642,074 | 68,284 | 33.3 | % | 32.6 | % | |||||||||||||||||||||
|
> 10 Yrs.
|
62,117 | 54,743 | 7,374 | 2.9 | % | 2.8 | % | |||||||||||||||||||||
|
Total Fixed Income
|
$ | 2,135,113 | $ | 1,970,189 | $ | 164,924 | 100.0 | % | 100.0 | % | ||||||||||||||||||
|
OK
|
OK
|
|||||||||||||||||||||||||||
|
Duration
|
||||||||||||||||||||||||||||
|
Fixed Income portfolio duration
|
3.7 | years | ||||||||||||||||||||||||||
|
Investment Portfolio - Quality Ratings As of June 30, 2011
|
PRIMERICA, INC.
|
| Financial Supplement |
|
(Dollars in thousands)
|
||||||||||
|
Investment Portfolio Quality Ratings (1)
|
||||||||||
|
Amortized
Cost
|
% of
Total
|
|||||||||
|
Total Fixed Income portfolio:
|
||||||||||
|
Rating
|
||||||||||
|
AAA
|
$ | 499,282 | 25.3 | % | ||||||
|
AA
|
193,817 | 9.8 | % | |||||||
| A | 445,900 | 22.6 | % | |||||||
|
BBB
|
706,325 | 35.9 | % | |||||||
|
Below Investment Grade
|
123,564 | 6.3 | % | |||||||
|
NA
|
1,301 | 0.1 | % |
OK
|
||||||
|
Total Fixed Income
|
$ | 1,970,189 | 100.0 | % | ||||||
|
Amortized
Cost
|
% of
Total
|
Amortized
Cost
|
% of
Total
|
|||||||||||||||||||||
|
Corporate asset class:
|
Private asset class:
|
|||||||||||||||||||||||
|
Rating
|
Rating
|
|||||||||||||||||||||||
|
AAA
|
$ | 350 | 0.0 | % |
AAA
|
$ | 268 | 0.3 | % | |||||||||||||||
|
AA
|
124,724 | 10.2 | % |
AA
|
6,535 | 6.3 | % | |||||||||||||||||
| A | 399,204 | 32.7 | % | A | 14,750 | 14.2 | % | |||||||||||||||||
|
BBB
|
614,062 | 50.3 | % |
BBB
|
66,980 | 64.7 | % | |||||||||||||||||
|
Below Investment Grade
|
81,411 | 6.7 | % |
Below Investment Grade
|
14,983 | 14.5 | % | |||||||||||||||||
|
NA
|
532 | 0.0 | % |
OK
|
NA
|
— | — |
OK
|
||||||||||||||||
|
Total Corporate
|
$ | 1,220,284 | 100.0 | % |
Total Private
|
$ | 103,515 | 100.0 | % | |||||||||||||||
|
CMBS asset class:
|
Mortgage-Backed asset class:
|
|||||||||||||||||||||||
|
Rating
|
Rating
|
|||||||||||||||||||||||
|
AAA
|
$ | 123,370 | 84.8 | % |
AAA
|
$ | 264,162 | 90.0 | % | |||||||||||||||
|
AA
|
18,508 | 12.7 | % |
AA
|
3,614 | 1.2 | % | |||||||||||||||||
| A | 1,201 | 0.8 | % | A | 3,129 | 1.1 | % | |||||||||||||||||
|
BBB
|
1,288 | 0.9 | % |
BBB
|
6,843 | 2.3 | % | |||||||||||||||||
|
Below Investment Grade
|
979 | 0.7 | % |
Below Investment Grade
|
15,673 | 5.3 | % | |||||||||||||||||
|
NA
|
104 | 0.1 | % |
OK
|
NA
|
— | — |
OK
|
||||||||||||||||
|
Total CMBS
|
$ | 145,449 | 100.0 | % |
Total Mortgage-Backed
|
$ | 293,420 | 100.0 | % | |||||||||||||||
|
Asset-Backed asset class:
|
Treasury & Government asset classes:
|
|||||||||||||||||||||||
|
Rating
|
Rating
|
|||||||||||||||||||||||
|
AAA
|
$ | 53,506 | 81.1 | % |
AAA
|
$ | 57,317 | 46.1 | % | |||||||||||||||
|
AA
|
— | — |
AA
|
34,627 | 27.9 | % | ||||||||||||||||||
| A | 1,449 | 2.2 | % | A | 22,635 | 18.2 | % | |||||||||||||||||
|
BBB
|
2,000 | 3.0 | % |
BBB
|
9,238 | 7.4 | % | |||||||||||||||||
|
Below Investment Grade
|
9,029 | 13.7 | % |
Below Investment Grade
|
— | — | ||||||||||||||||||
|
NA
|
— | — |
OK
|
NA
|
516 | 0.4 | % |
OK
|
||||||||||||||||
|
Total Asset-Backed
|
$ | 65,984 | 100.0 | % |
Total Treasury & Government
|
$ | 124,333 | 100.0 | % | |||||||||||||||
|
NAIC Designations
|
||||||||||||||||||||||||
| 1 | $ | 1,029,766 | 57.3 | % | ||||||||||||||||||||
| 2 | 665,714 | 37.1 | % | |||||||||||||||||||||
| 3 | 73,381 | 4.1 | % | |||||||||||||||||||||
| 4 | 19,244 | 1.1 | % | |||||||||||||||||||||
| 5 | 5,769 | 0.3 | % | |||||||||||||||||||||
| 6 | 2,336 | 0.1 | % | |||||||||||||||||||||
|
U.S. Insurer Fixed Income (2)
|
1,796,210 | 100.0 | % | |||||||||||||||||||||
|
Other (3)
|
190,584 | |||||||||||||||||||||||
|
Cash and cash equivalents
|
114,051 | |||||||||||||||||||||||
|
Total Invested Assets
|
$ | 2,100,845 |
OK
|
|||||||||||||||||||||
| (1 | ) |
Ratings method for split ratings: If by 2 NRSROs, use lower of the two; if by 3 or more NRSROs, use second lowest
|
| (2 | ) |
NAIC ratings for our U.S. insurance companies' fixed income portfolios
|
| (3 | ) |
Other consists of assets held by our non-life companies, Canadian insurance company, and unrated equities
|
|
Investment Portfolio - Mortgage Backed Vintage Analysis As of June 30, 2011
|
PRIMERICA, INC.
|
| Financial Supplement |
|
(Dollars in thousands)
|
2004 and Prior
|
2005
|
2006
|
2007
|
2008
|
2009
|
2010
|
2011
|
Total
|
|||||||||||||||||||||||||||||
|
Commercial Mortgage-Backed Securities
|
Amortized Cost by Vintage
|
|||||||||||||||||||||||||||||||||||||
|
Current Rating:
|
||||||||||||||||||||||||||||||||||||||
|
AAA
|
$ | 61,980 | $ | 22,906 | $ | 6,139 | $ | 7,784 | $ | 1,165 | $ | 5,927 | $ | 4,592 | $ | 12,878 | $ | 123,370 | ||||||||||||||||||||
|
AA
|
8,249 | 10,259 | — | — | — | — | — | — | 18,508 | |||||||||||||||||||||||||||||
| A | 1,001 | — | 200 | — | — | — | — | — | 1,201 | |||||||||||||||||||||||||||||
|
BBB
|
1,288 | — | — | — | — | — | — | — | 1,288 | |||||||||||||||||||||||||||||
|
BB
|
255 | — | — | — | — | — | — | — | 255 | |||||||||||||||||||||||||||||
| B | 288 | — | — | — | — | — | — | — | 288 | |||||||||||||||||||||||||||||
|
CCC and lower
|
315 | 224 | — | — | — | — | — | — | 539 | |||||||||||||||||||||||||||||
|
Total
|
$ | 73,376 | $ | 33,389 | $ | 6,339 | $ | 7,784 | $ | 1,165 | $ | 5,927 | $ | 4,592 | $ | 12,878 | $ | 145,449 | ||||||||||||||||||||
|
Net Unrealized Gain/(Loss) by Vintage
|
|||||||||||||||||||||||||||||||||||||||
|
Current Rating:
|
|||||||||||||||||||||||||||||||||||||||
|
AAA
|
$ | 2,516 | $ | 1,051 | $ | 669 | $ | 660 | $ | 38 | $ | 242 | $ | (10 | ) | $ | 22 | $ | 5,188 | ||||||||||||||||||||
|
AA
|
478 | 26 | — | — | — | — | — | — | 504 | ||||||||||||||||||||||||||||||
| A | 13 | — | 12 | — | — | — | — | — | 25 | ||||||||||||||||||||||||||||||
|
BBB
|
(106 | ) | — | — | — | — | — | — | — | (106 | ) | ||||||||||||||||||||||||||||
|
BB
|
900 | — | — | — | — | — | — | — | 900 | ||||||||||||||||||||||||||||||
| B | 529 | — | — | — | — | — | — | — | 529 | ||||||||||||||||||||||||||||||
|
CCC and lower
|
248 | — | — | — | — | — | — | — | 248 | ||||||||||||||||||||||||||||||
|
Total
|
$ | 4,577 | $ | 1,077 | $ | 681 | $ | 660 | $ | 38 | $ | 242 | $ | (10 | ) | $ | 22 | $ | 7,287 | ||||||||||||||||||||
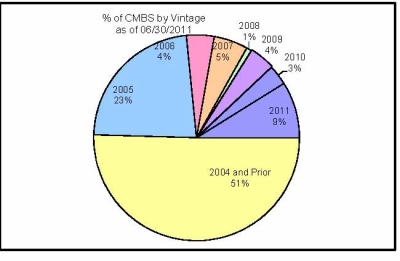
|
OK
|
|||||||||||||||||||||||||||||||||||||||
|
Prime Residential Mortgage-Backed Securities
|
Amortized Cost by Vintage
|
||||||||||||||||||||||||||||||||||||||
|
Current Rating:
|
|||||||||||||||||||||||||||||||||||||||
|
AAA
|
$ | 125,443 | $ | 24,438 | $ | 24,801 | $ | 40,983 | $ | 26,899 | $ | 240 | $ | 5,750 | $ | 14,240 | $ | 262,794 | |||||||||||||||||||||
|
AA
|
3,614 | — | — | — | — | — | — | — | 3,614 | ||||||||||||||||||||||||||||||
| A | 1,514 | 1,615 | — | — | — | — | — | — | 3,129 | ||||||||||||||||||||||||||||||
|
BBB
|
— | 6,843 | — | — | — | — | — | — | 6,843 | ||||||||||||||||||||||||||||||
|
BB
|
715 | 3,781 | — | — | — | — | — | — | 4,496 | ||||||||||||||||||||||||||||||
| B | — | 1,666 | — | — | — | — | — | — | 1,666 | ||||||||||||||||||||||||||||||
|
CCC and lower
|
— | 1,243 | — | 1,639 | — | — | — | — | 2,882 | ||||||||||||||||||||||||||||||
|
Total
|
$ | 131,286 | $ | 39,585 | $ | 24,801 | $ | 42,622 | $ | 26,899 | $ | 240 | $ | 5,750 | $ | 14,240 | $ | 285,423 | |||||||||||||||||||||
| 46 | % | 14 | % | 9 | % | 15 | % | 9 | % | 0 | % | 2 | % | 5 | % | ||||||||||||||||||||||||
|
Net Unrealized Gain/(Loss) by Vintage
|
|||||||||||||||||||||||||||||||||||||||
|
Current Rating:
|
|||||||||||||||||||||||||||||||||||||||
|
AAA
|
$ | 12,509 | $ | 1,182 | $ | 2,523 | $ | 3,914 | $ | 2,901 | $ | 25 | $ | 95 | $ | 358 | $ | 23,507 | |||||||||||||||||||||
|
AA
|
134 | — | — | — | — | — | — | — | 134 | ||||||||||||||||||||||||||||||
| A | 28 | 12 | — | — | — | — | — | — | 40 | ||||||||||||||||||||||||||||||
|
BBB
|
— | (300 | ) | — | — | — | — | — | — | (300 | ) | ||||||||||||||||||||||||||||
|
BB
|
22 | (111 | ) | — | — | — | — | — | — | (89 | ) | ||||||||||||||||||||||||||||
| B | — | (24 | ) | — | — | — | — | — | — | (24 | ) | ||||||||||||||||||||||||||||
|
CCC and lower
|
— | (24 | ) | — | 28 | — | — | — | — | 5 | |||||||||||||||||||||||||||||
|
Total
|
$ | 12,693 | $ | 735 | $ | 2,523 | $ | 3,942 | $ | 2,901 | $ | 25 | $ | 95 | $ | 358 | $ | 23,273 | |||||||||||||||||||||
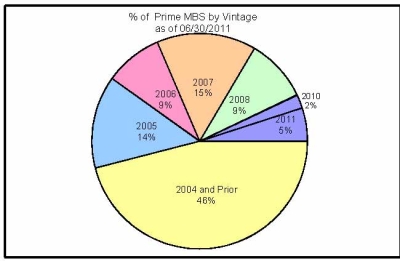
|
Alt-A Residential Mortgage-Backed Securities
|
Amortized Cost by Vintage
|
|||||||||||||||||||||||||||||||||||||
|
Current Rating:
|
||||||||||||||||||||||||||||||||||||||
|
AAA
|
$ | — | $ | 1,369 | $ | — | $ | — | $ | — | $ | — | $ | — | $ | — | $ | 1,369 | ||||||||||||||||||||
|
AA
|
— | — | — | — | — | — | — | — | — | |||||||||||||||||||||||||||||
| A | — | — | — | — | — | — | — | — | — | |||||||||||||||||||||||||||||
|
BBB
|
— | — | — | — | — | — | — | — | — | |||||||||||||||||||||||||||||
|
BB
|
617 | — | — | — | — | — | — | — | 617 | |||||||||||||||||||||||||||||
| B | — | 3,200 | — | — | — | — | — | — | 3,200 | |||||||||||||||||||||||||||||
|
CCC and lower
|
2,544 | 268 | — | — | — | — | — | — | 2,812 | |||||||||||||||||||||||||||||
|
Total
|
$ | 3,161 | $ | 4,836 | $ | — | $ | — | $ | — | $ | — | $ | — | $ | — | $ | 7,997 | ||||||||||||||||||||
| 40 | % | 60 | % | 0 | % | 0 | % | 0 | % | 0 | % | 0 | % | 0 | % | |||||||||||||||||||||||
|
Net Unrealized Gain/(Loss) by Vintage
|
||||||||||||||||||||||||||||||||||||||
|
Current Rating:
|
||||||||||||||||||||||||||||||||||||||
|
AAA
|
$ | — | $ | 32 | $ | — | $ | — | $ | — | $ | — | $ | — | $ | — | $ | 32 | ||||||||||||||||||||
|
AA
|
— | — | — | — | — | — | — | — | — | |||||||||||||||||||||||||||||
| A | — | — | — | — | — | — | — | — | — | |||||||||||||||||||||||||||||
|
BBB
|
— | — | — | — | — | — | — | — | — | |||||||||||||||||||||||||||||
|
BB
|
25 | — | — | — | — | — | — | — | 25 | |||||||||||||||||||||||||||||
| B | — | (9 | ) | — | — | — | — | — | — | (9 | ) | |||||||||||||||||||||||||||
|
CCC and lower
|
(5 | ) | (11 | ) | — | — | — | — | — | — | (16 | ) | ||||||||||||||||||||||||||
|
Total
|
$ | 20 | $ | 13 | $ | — | $ | — | $ | — | $ | — | $ | — | $ | — | $ | 32 | ||||||||||||||||||||
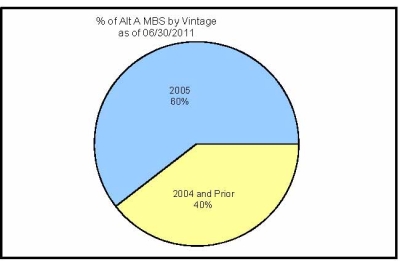
|
Investment Portfolio - Supplemental Data and Trends
|
PRIMERICA, INC.
|
| Financial Supplement |
|
YOY Q2
|
|||||||||||||||||||||||||||||||||||||||||||
|
(Dollars in thousands)
|
Q1 2010 | Q2 2010 | Q3 2010 | Q4 2010 | Q1 2011 | Q2 2011 |
$
Change
|
%
Change
|
|||||||||||||||||||||||||||||||||||
|
Net Investment Income by Source
|
|||||||||||||||||||||||||||||||||||||||||||
|
Bonds & notes
|
$ | 83,814 | $ | 27,796 | $ | 28,350 | $ | 28,091 | $ | 29,014 | $ | 27,462 | $ | (334 | ) | -1.2 | % | ||||||||||||||||||||||||||
|
Preferred and common stocks
|
1,239 | 164 | 189 | 231 | 188 | 165 | 1 |
nm
|
|||||||||||||||||||||||||||||||||||
|
Deposit asset underlying 10% reinsurance treaty
|
— | 1,551 | 624 | (704 | ) | 508 | 650 | (901 | ) | -58.1 | % | ||||||||||||||||||||||||||||||||
|
Policy loans
|
336 | 341 | 326 | 362 | 347 | 306 | (35 | ) | -10.2 | % | |||||||||||||||||||||||||||||||||
|
Cash & cash equivalents
|
283 | 85 | 103 | 73 | 70 | 65 | (20 | ) | -23.5 | % | |||||||||||||||||||||||||||||||||
|
Other
|
— | 55 | — | — | (19 | ) | 13 | (42 | ) | -75.8 | % | ||||||||||||||||||||||||||||||||
|
Total investment income
|
85,671 | 29,992 | 29,591 | 28,053 | 30,108 | 28,662 | (1,331 | ) | -4.4 | % | |||||||||||||||||||||||||||||||||
|
Investment expenses
|
3,095 | 2,001 | 1,737 | 1,365 | 1,482 | 1,433 | (568 | ) | -28.4 | % | |||||||||||||||||||||||||||||||||
|
Net investment income
|
$ | 82,576 | $ | 27,991 | $ | 27,855 | $ | 26,688 | $ | 28,626 | $ | 27,229 | $ | (763 | ) | -2.7 | % | ||||||||||||||||||||||||||
|
Fixed income book yield, end of period
|
5.79 | % | 5.72 | % | 5.47 | % | 5.48 | % | 5.30 | % | 5.38 | % |
na
|
-34 bps
|
|||||||||||||||||||||||||||||
|
New money yield
|
3.48 | % | 2.43 | % | 2.50 | % | 3.58 | % | 2.72 | % | 4.45 | % |
na
|
202 bps
|
|||||||||||||||||||||||||||||
|
YOY Q2
|
|||||||||||||||||||||||||||||||||||||||||||
| Q1 2010 | Q2 2010 | Q3 2010 | Q4 2010 | Q1 2011 | Q2 2011 |
% Pt
Change
|
|||||||||||||||||||||||||||||||||||||
|
Fixed Income Portfolio Quality Ratings
|
|||||||||||||||||||||||||||||||||||||||||||
|
Rating
|
|||||||||||||||||||||||||||||||||||||||||||
|
AAA
|
32.5 | % | 31.4 | % | 28.0 | % | 26.7 | % | 26.1 | % | 25.3 | % | -7.2 | % | |||||||||||||||||||||||||||||
|
AA
|
7.9 | % | 6.9 | % | 8.0 | % | 9.1 | % | 9.5 | % | 9.8 | % | 1.9 | % | |||||||||||||||||||||||||||||
| A | 21.2 | % | 21.4 | % | 22.2 | % | 21.9 | % | 22.4 | % | 22.6 | % | 1.4 | % | |||||||||||||||||||||||||||||
|
BBB
|
30.8 | % | 32.4 | % | 34.8 | % | 35.6 | % | 35.8 | % | 35.9 | % | 5.0 | % | |||||||||||||||||||||||||||||
|
Below Investment Grade
|
7.1 | % | 7.8 | % | 6.9 | % | 6.7 | % | 6.2 | % | 6.3 | % | -0.8 | % | |||||||||||||||||||||||||||||
|
NA
|
0.4 | % | 0.1 | % | 0.1 | % | 0.1 | % | 0.0 | % | 0.1 | % | -0.3 | % | |||||||||||||||||||||||||||||
|
Total Fixed Income
|
100.0 | % | 100.0 | % | 100.0 | % | 100.0 | % | 100.0 | % | 100.0 | % |
nm
|
||||||||||||||||||||||||||||||
|
Average rating by amortized cost
|
A | A | A | A | A | A |
na
|
||||||||||||||||||||||||||||||||||||
|
As of June 30, 2011
|
As of June 30, 2011
|
||||||||||||||||||||||||||||||||||||||||||
|
Market
Value
|
Amortized
Cost
|
Credit
Rating
|
Market
Value
|
Amortized
Cost
|
|||||||||||||||||||||||||||||||||||||||
|
Top 25 Exposures
|
Foreign Exposure (1)
|
||||||||||||||||||||||||||||||||||||||||||
| 1 |
Government of Canada
|
$ | 38,266 | $ | 33,282 |
AAA
|
Canada
|
$ | 63,354 | $ | 59,106 | ||||||||||||||||||||||||||||||||
| 2 |
National Rural Utilities Cooperative
|
17,929 | 14,900 | A+ |
United Kingdom
|
71,292 | 67,104 | ||||||||||||||||||||||||||||||||||||
| 3 |
General Electric Co
|
15,448 | 13,549 |
AA+
|
Australia
|
46,974 | 43,237 | ||||||||||||||||||||||||||||||||||||
| 4 |
Bank of America Corp
|
13,872 | 12,713 | A |
France
|
28,711 | 27,327 | ||||||||||||||||||||||||||||||||||||
| 5 |
Verizon Communications Inc
|
13,230 | 11,488 | A- |
Spain
|
22,114 | 22,053 | ||||||||||||||||||||||||||||||||||||
| 6 |
ProLogis Inc
|
12,634 | 11,741 |
BBB-
|
Japan
|
5,594 | 5,367 | ||||||||||||||||||||||||||||||||||||
| 7 |
Enel SpA
|
10,767 | 10,542 | A- |
Italy
|
13,849 | 13,540 | ||||||||||||||||||||||||||||||||||||
| 8 |
Edison International
|
10,725 | 10,547 | B+ |
Emerging Markets (2)
|
42,687 | 39,036 | ||||||||||||||||||||||||||||||||||||
| 9 |
ConocoPhillips
|
10,485 | 9,058 | A |
All Other
|
100,488 | 92,052 | ||||||||||||||||||||||||||||||||||||
| 10 |
Banco Santander SA
|
9,994 | 9,930 |
AA
|
Total
|
$ | 395,062 | $ | 368,823 |
OK
|
|||||||||||||||||||||||||||||||||
| 11 |
MetLife Inc
|
9,975 | 9,468 | A+ | |||||||||||||||||||||||||||||||||||||||
| 12 |
AT&T Inc
|
9,944 | 8,789 | A- |
Government Investments
|
||||||||||||||||||||||||||||||||||||||
| 13 |
Reynolds American Inc
|
9,623 | 7,924 |
BBB
|
|||||||||||||||||||||||||||||||||||||||
| 14 |
Xstrata PLC
|
9,580 | 9,290 |
BBB+
|
AAA
|
$ | — | $ | — | ||||||||||||||||||||||||||||||||||
| 15 |
Iberdrola SA
|
9,380 | 8,468 |
BBB+
|
AA
|
2,898 | 2,572 | ||||||||||||||||||||||||||||||||||||
| 16 |
Province of Quebec Canada
|
9,372 | 7,667 | A+ | A | 13,048 | 12,282 | ||||||||||||||||||||||||||||||||||||
| 17 |
Diageo PLC
|
9,289 | 8,640 | A- |
BBB
|
10,301 | 9,238 | ||||||||||||||||||||||||||||||||||||
| 18 |
Health Care REIT Inc
|
9,105 | 9,132 |
BBB-
|
Below Investment Grade
|
— | — | ||||||||||||||||||||||||||||||||||||
| 19 |
Altria Group Inc
|
8,953 | 7,395 |
BBB
|
NA
|
— | — | ||||||||||||||||||||||||||||||||||||
| 20 |
Province of Ontario Canada
|
8,590 | 6,750 |
AA-
|
Total
|
$ | 26,247 | $ | 24,092 | ||||||||||||||||||||||||||||||||||
| 21 | Vale SA | 7,903 | 7,100 |
BBB+
|
|||||||||||||||||||||||||||||||||||||||
| 22 |
ArcelorMittal
|
7,785 | 6,581 |
BBB-
|
Non-Government Investments
|
||||||||||||||||||||||||||||||||||||||
| 23 |
Montpelier Re Holdings Ltd
|
7,628 | 7,207 |
BBB
|
|||||||||||||||||||||||||||||||||||||||
| 24 |
Roche Holding AG
|
7,608 | 6,555 |
AA-
|
AAA
|
$ | — | $ | — | ||||||||||||||||||||||||||||||||||
| 25 |
Ventas Inc
|
7,589 | 7,360 |
BBB
|
AA
|
58,517 | 55,939 | ||||||||||||||||||||||||||||||||||||
|
Total
|
$ | 285,676 | $ | 256,077 | A | 141,502 | 133,678 | ||||||||||||||||||||||||||||||||||||
|
BBB
|
151,058 | 139,315 | |||||||||||||||||||||||||||||||||||||||||
|
% of total fixed income portfolio
|
13.2 | % | 12.7 | % |
Below Investment Grade
|
15,155 | 14,799 | ||||||||||||||||||||||||||||||||||||
|
NA
|
2,583 | 1,000 | |||||||||||||||||||||||||||||||||||||||||
|
Total
|
$ | 368,815 | $ | 344,730 |
OK
|
||||||||||||||||||||||||||||||||||||||
| (1 | ) |
US$ denominated investments in issuers outside of the United States based on country of risk
|
| (2 | ) |
Emerging markets is as defined by MSCI, Inc. which include Brazil, Chile, Colombia, India, Korea, Mexico, Peru, Poland and South Africa
|
|
Five-Year Historical Key Statistics
|
PRIMERICA, INC.
|
| Financial Supplement |
|
(Dollars in millions)
|
2006
|
2007
|
2008
|
2009
|
2010
|
Q1
2010
|
Q2
2010
|
Q3
2010
|
Q4
2010
|
Q1
2011
|
Q2
2011
|
|||||||||||||||||||||||||||||||||
|
Recruits
|
204,316 | 220,950 | 235,125 | 221,920 | 231,390 | 58,085 | 65,245 | 58,178 | 49,882 | 52,813 | 65,138 | |||||||||||||||||||||||||||||||||
|
Life-insurance licensed sales force, beginning of period
|
97,105 | 96,532 | 97,125 | 100,651 | 99,785 | 99,785 | 97,354 | 96,066 | 96,872 | 94,850 | 92,212 | |||||||||||||||||||||||||||||||||
|
New life-licensed representatives
|
35,233 | 36,308 | 39,383 | 37,629 | 34,488 | 7,366 | 9,887 | 9,430 | 7,805 | 7,145 | 8,061 | |||||||||||||||||||||||||||||||||
|
Non-renewal and terminated representatives
|
(35,806 | ) | (35,715 | ) | (35,857 | ) | (38,495 | ) | (39,423 | ) | (9,797 | ) | (11,175 | ) | (8,624 | ) | (9,827 | ) | (9,783 | ) | (9,754 | ) | ||||||||||||||||||||||
|
Life-insurance licensed sales force, end of period
|
96,532 | 97,125 | 100,651 | 99,785 | 94,850 | 97,354 | 96,066 | 96,872 | 94,850 | 92,212 | 90,519 | |||||||||||||||||||||||||||||||||
|
Issued term life policies
|
245,520 | 244,733 | 241,173 | 233,837 | 223,514 | 52,445 | 60,406 | 54,373 | 56,290 | 51,281 | 59,826 | |||||||||||||||||||||||||||||||||
|
Issued term life face amount
|
$ | 84,503 | $ | 87,619 | $ | 87,279 | $ | 80,497 | $ | 74,401 | $ | 17,997 | $ | 20,042 | $ | 18,113 | $ | 18,250 | $ | 16,735 | $ | 18,974 | ||||||||||||||||||||||
|
Term life face amount in force, beginning of period
|
$ | 572,155 | $ | 599,470 | $ | 632,086 | $ | 633,467 | $ | 650,195 | $ | 650,195 | $ | 651,790 | $ | 653,530 | $ | 654,633 | $ | 656,791 | $ | 658,523 | ||||||||||||||||||||||
|
Issued term life face amount
|
84,503 | 87,619 | 87,279 | 80,497 | 74,401 | 17,997 | 20,042 | 18,113 | 18,250 | 16,735 | 18,974 | |||||||||||||||||||||||||||||||||
|
Terminated term life face amount
|
(57,277 | ) | (64,966 | ) | (72,008 | ) | (74,642 | ) | (70,964 | ) | (18,867 | ) | (16,156 | ) | (17,836 | ) | (18,105 | ) | (17,247 | ) | (14,724 | ) | ||||||||||||||||||||||
|
Foreign currency impact, net
|
90 | 9,963 | (13,891 | ) | 10,873 | 3,158 | 2,464 | (2,146 | ) | 826 | 2,013 | 2,244 | 843 | |||||||||||||||||||||||||||||||
|
Term life face amount in force, end of period
|
$ | 599,470 | $ | 632,086 | $ | 633,467 | $ | 650,195 | $ | 656,791 | $ | 651,790 | $ | 653,530 | $ | 654,633 | $ | 656,791 | $ | 658,523 | $ | 663,617 | ||||||||||||||||||||||
|
Estimated annualized issued term life premium
|
||||||||||||||||||||||||||||||||||||||||||||
|
Premium from new policies
|
$ | 204.7 | $ | 208.9 | $ | 205.0 | $ | 193.7 | $ | 180.8 | $ | 43.4 | $ | 48.9 | $ | 44.1 | $ | 44.5 | $ | 41.1 | $ | 47.5 | ||||||||||||||||||||||
|
Additions and increases in premium
|
41.1 | 43.4 | 43.0 | 42.6 | 44.6 | 10.8 | 11.7 | 10.9 | 11.2 | 10.4 | 11.4 | |||||||||||||||||||||||||||||||||
|
Total estimated annualized issued term life premium
|
$ | 245.8 | $ | 252.4 | $ | 248.0 | $ | 236.3 | $ | 225.4 | $ | 54.2 | $ | 60.6 | $ | 55.0 | $ | 55.6 | $ | 51.5 | $ | 58.9 | ||||||||||||||||||||||
|
Investment & Savings product sales
|
$ | 4,664.7 | $ | 5,189.5 | $ | 4,458.4 | $ | 3,006.6 | $ | 3,623.6 | $ | 973.5 | $ | 923.3 | $ | 823.9 | $ | 903.0 | $ | 1,113.7 | $ | 1,135.5 | ||||||||||||||||||||||
|
Investment & Savings average client asset values
|
$ | 32,082 | $ | 36,735 | $ | 32,763 | $ | 26,845 | $ | 31,908 | $ | 31,404 | $ | 31,561 | $ | 31,056 | $ | 33,611 | $ | 35,602 | $ | 36,463 | ||||||||||||||||||||||