
UNITED STATES
SECURITIES AND EXCHANGE COMMISSION
Washington, D.C. 20549
FORM
(Mark One)
For the fiscal year ended
OR
For the transition period from to
Commission File Number:
(Exact name of registrant as specified in its charter)
|
||
(State or other jurisdiction of incorporation or organization) |
|
(I.R.S. Employer Identification No.) |
|
|
|
|
||
(Address of principal executive offices) |
|
(ZIP Code) |
Registrant’s telephone number, including area code: (
Securities registered pursuant to Section 12(b) of the Act:
Title of each class |
|
Trading Symbol(s) |
|
Name of each exchange on which registered |
|
|
Securities registered pursuant to Section 12(g) of the Act: None
Indicate by check mark if the registrant is a well-known seasoned issuer, as defined in Rule 405 of the Securities Act. ☒
Indicate by check mark if the registrant is not required to file reports pursuant to Section 13 or Section 15(d) of the Act. ☐ Yes ☒
Indicate by check mark whether the registrant (1) has filed all reports required to be filed by Section 13 or 15(d) of the Securities Exchange Act of 1934 during the preceding 12 months (or for such shorter period that the registrant was required to file such reports), and (2) has been subject to such filing requirements for the past 90 days. ☒
Indicate by check mark whether the registrant has submitted electronically every Interactive Data File required to be submitted pursuant to Rule 405 of Regulation S-T (§232.405 of this chapter) during the preceding 12 months (or for such shorter period that the registrant was required to submit such files). ☒
Indicate by check mark whether the registrant is a large accelerated filer, an accelerated filer, a non-accelerated filer, a smaller reporting company, or an emerging growth company. See the definitions of “large accelerated filer,” “accelerated filer,” “smaller reporting company,” and “emerging growth company” in Rule 12b-2 of the Exchange Act.
|
☒ |
|
Accelerated filer |
|
☐ |
|
|
|
|
|
|||
Non-accelerated filer |
|
☐ |
|
Smaller reporting company |
|
|
|
|
|
|
|||
|
|
|
|
Emerging growth company |
|
|
If an emerging growth company, indicate by check mark if the registrant has elected not to use the extended transition period for complying with any new or revised financial accounting standards provided pursuant to Section 13(a) of the Exchange Act. ☐
Indicate by check mark whether the registrant has filed a report on and attestation to its management’s assessment of the effectiveness of its internal control over financial reporting under Section 404(b) of the Sarbanes-Oxley Act (15 U.S.C. 7262(b)) by the registered public accounting firm that prepared or issued its audit report.
If securities are registered pursuant to Section 12(b) of the Act, indicate by check mark whether the financial statements of the registrant included in the filing reflect the correction of an error to previously issued financial statements.
Indicate by check mark whether any of those error corrections are restatements that required a recovery analysis of incentive-based compensation received by any of the registrant’s executive officers during the relevant recovery period pursuant to §240.10D-1(b). ☐
Indicate by check mark whether the registrant is a shell company (as defined in Rule 12b-2 of the Exchange Act). ☐ Yes
The aggregate market value of the voting common equity held by non-affiliates of the registrant as of June 30, 2023, was $
Documents Incorporated By Reference
Certain information contained in the Proxy Statement for the Company’s Annual Meeting of Stockholders to be held on May 8, 2024 is incorporated by reference into Part III hereof.
i
TABLE OF CONTENTS
|
|
|
|
Page |
|
|
|
iii |
|
|
|
|
iii |
|
|
|
|
|
|
|
|
|
1 |
|
Item 1. |
|
|
1 |
|
Item 1A. |
|
|
24 |
|
Item 1B. |
|
|
42 |
|
Item 1C. |
|
|
42 |
|
Item 2. |
|
|
43 |
|
Item 3. |
|
|
44 |
|
Item 4. |
|
|
44 |
|
Item X. |
|
Information About Our Executive Officers and Certain Significant Employees |
|
44 |
|
|
|
||
|
|
|
47 |
|
Item 5. |
|
|
47 |
|
Item 6. |
|
|
48 |
|
Item 7. |
|
Management’s Discussion and Analysis of Financial Condition and Results of Operations |
|
49 |
Item 7A. |
|
|
75 |
|
Item 8. |
|
|
77 |
|
Item 9. |
|
Changes in and Disagreements With Accountants on Accounting and Financial Disclosure |
|
125 |
Item 9A. |
|
|
125 |
|
Item 9B. |
|
|
127 |
|
Item 9C. |
|
Disclosure Regarding Foreign Jurisdictions that Prevent Inspections |
|
127 |
|
|
|
||
PART III |
|
|
|
|
Item 10. |
|
|
128 |
|
Item 11. |
|
|
128 |
|
Item 12. |
|
Security Ownership of Certain Beneficial Owners and Management and Related Stockholder Matters |
|
128 |
Item 13. |
|
Certain Relationships and Related Transactions, and Director Independence |
|
129 |
Item 14. |
|
|
129 |
|
|
|
|
||
|
|
|
130 |
|
Item 15. |
|
|
130 |
|
Item 16. |
|
|
143 |
|
|
|
|
144 |
|
ii
CAUTIONARY STATEMENT CONCERNING FORWARD-LOOKING STATEMENTS
Investors are cautioned that certain statements contained in this report as well as some statements in periodic press releases and some oral statements made by our officials during our presentations are “forward-looking” statements. Forward-looking statements include, without limitation, any statement that may project, indicate or imply future results, events, performance or achievements, and may contain the words “expect”, “intend”, “plan”, “anticipate”, “estimate”, “believe”, “will be”, “will continue”, “will likely result”, and similar expressions, or future conditional verbs such as “may”, “will”, “should”, “would”, and “could”. In addition, any statement concerning future financial performance (including future revenues, earnings or growth rates), ongoing business strategies or prospects, and possible actions taken by us or our subsidiaries are also forward-looking statements.
Forward-looking statements are based on current expectations and projections about future events and are inherently subject to a variety of risks and uncertainties, many of which are beyond the control of our management team. All forward-looking statements in this report and subsequent written and oral forward-looking statements attributable to us, or to persons acting on our behalf, are expressly qualified in their entirety by these risks and uncertainties. These risks and uncertainties are described under “Item IA. Risk Factors” and summarized below under “Risk Factors Summary.”
Developments in any of the areas addressed in these risks or uncertainties could cause actual results to differ materially from those anticipated or projected or cause a significant reduction in the market price of our common stock. Further, the risks and uncertainties described under “Item IA. Risk Factors” and summarized below under “Risk Factors Summary” may not include all of the risks and uncertainties that could affect us. In addition, in light of these risks and uncertainties, the matters referred to in the forward-looking statements contained in this report may not in fact occur. Accordingly, undue reliance should not be placed on these statements. We undertake no obligation to publicly update or revise any forward-looking statements as a result of new information, future events or otherwise, except as otherwise required by law.
Risk factors summary
The following is a summary of the risks and uncertainties that could have a material adverse effect on our business. See “Item 1A. Risk Factors” for additional information regarding these risks and uncertainties.
Risks Related to Our Distribution Structure
Risks Related to Our Insurance Business and Reinsurance
Risks Related to Our Investment and Savings Products Business
iii
Risks Related to e-TeleQuote’s Senior Health Insurance Distribution Business
Risks Related to Our Mortgage Distribution Business
Risks Related to Economic Downcycles, Public Health Crises or Catastrophes, and Disasters
Risks Related to Information Technology and Cybersecurity
Financial Risks Affecting Our Business
iv
Risks Related to Legislative and Regulatory Changes
General Risk Factors
v
PART I
ITEM 1. BUSINESS.
Primerica, Inc. (“Primerica” or the “Parent Company” and, together with its direct and indirect subsidiaries, “we”, “us” or the “Company”) is a leading provider of financial products and services to middle-income households in the United States and Canada with 141,572 life insurance-licensed sales representatives as of December 31, 2023. These independent licensed representatives (“independent sales representatives” or “independent sales force”) assist our clients in meeting their needs for term life insurance, which we underwrite, and mutual funds, annuities, managed investments, Medicare-related insurance products and other financial products, which we distribute primarily on behalf of third parties. We insured approximately 5.7 million lives and had approximately 2.9 million client investment accounts as of December 31, 2023. Our business model uniquely positions us to reach underserved middle-income consumers in a cost-effective manner and has proven itself in both favorable and challenging economic environments.
Our mission is to serve middle-income families by helping them make informed financial decisions and providing them with a strategy and tools to gain financial independence. Our distribution model is designed to:
We believe there is significant opportunity to meet the increasing array of financial services needs of our clients. We intend to leverage the independent sales force to meet such client needs, which will drive long-term value for all of our stakeholders. Our strategy during 2023 was organized across four primary areas:
Corporate Structure
We conduct our core business activities in the United States through four principal entities, all of which are direct or indirect wholly owned subsidiaries of the Parent Company:
Primerica Life is domiciled in Tennessee, and its wholly owned subsidiary, National Benefit Life Insurance Company (“NBLIC”), is a New York-domiciled life insurance underwriting company.
We conduct our core business activities in Canada through three principal entities, all of which are indirect wholly owned subsidiaries of the Parent Company:
Primerica was incorporated in the United States as a Delaware corporation in October 2009 to serve as a holding company for the Primerica businesses (collectively, the “Company”). Except for e-TeleQuote, which was acquired on July 1, 2021, our businesses were transferred to us by Citigroup, Inc. on April 1, 2010 in a reorganization pursuant to which we completed an initial public offering in April 2010 (the “IPO”). On March 31, 2010, we entered into certain coinsurance transactions to cede between 80% and 90% of the risks and rewards of our term life insurance policies that were in force at year-end 2009. We administer pre-IPO policies subject to these coinsurance agreements.
1
Our Clients
Our clients are generally middle-income consumers, which we define as households with $30,000 to $130,000 of annual income. According to the 2022 U.S. Census Bureau Current Population Survey, the latest period for which data is available, approximately 54% of U.S. households fall in this range. We believe that we understand the financial needs of the middle-income segment, which include:
Our Distribution Model
Our distribution model is a modified traditional insurance agency model designed to reach and serve middle-income consumers efficiently through the independent sales force. Key characteristics of our unique distribution model include:
2
Structure and Scalability of the Independent Sales Force
New independent sales representatives are recruited by existing independent sales representatives. When these new recruits become independent sales representatives, they become part of the sales organization of the independent sales representative who recruited them as well as the sales organizations to which the recruiting independent sales representative belongs. We encourage independent sales representatives to bring in new recruits to build their own sales organizations, enabling the Company to reach more middle-income families.
RVPs establish and maintain their own offices, which we refer to as field offices. Additionally, as independent entrepreneurs, they are responsible for, and have control over, the costs of their administrative staff, marketing materials, travel, training and certain recognition events for the independent sales representatives in their respective sales organizations. Field offices provide a location for independent sales representatives to conduct recruiting meetings, training events and sales-related meetings, disseminate our Intranet-streamed broadcasts, conduct compliance functions, and house field office business records. Some business locations house more than one field office. At December 31, 2023, approximately 6,000 field offices in 3,300 locations were managed by independent sales representatives that served as RVPs. Independent sales representatives also leverage remote communication tools to conduct field office meetings. RVPs play a major role in training, motivating and monitoring their independent sales force organization.
Because the independent sales representative’s compensation grows with the productivity of his or her sales organization, our distribution model provides financial rewards to independent sales representatives who successfully develop, support and monitor productive independent sales representatives. In addition to our commission structure, we offer the Primerica Ownership Program. This program provides qualifying RVPs a contractual right, upon meeting certain criteria, to transfer their Primerica businesses to another RVP or a qualifying family member at such time as they desire. Furthermore, we have developed proprietary tools and technology, which we make available to the independent sales representatives, to enable RVPs to reduce the time spent on administrative responsibilities associated with their sales organizations so they can devote more time to the sales, recruiting and training activities that drive our growth. We believe that our tools and technology, coupled with our sales compensation programs, further incentivize independent sales representatives to become RVPs.
Both the structure of the independent sales force and the capacity of our support capabilities provide us with a high degree of scalability as we grow our business. Our support systems and technology are capable of supporting a large independent sales force and a high volume of transactions. In addition, by sharing training and compliance activities with RVPs, we are able to grow the Company without incurring proportionate overhead expenses.
Recruitment of Independent Sales Representatives
The recruitment of independent sales representatives is undertaken by existing independent sales representatives, who identify prospects and share with them the benefits of associating with our organization. Independent sales representatives showcase the Company as dynamic and capable of improving the lives of middle-income families.
3
After the initial contact, independent sales representatives typically invite prospective recruits to an opportunity meeting, conducted in person or through remote communication tools, which is conducted by an RVP. The objective of an opportunity meeting is to inform prospective recruits about our mission and their opportunity to start their own businesses by becoming independent sales representatives. At the conclusion of each opportunity meeting, attendees who are interested are asked to complete an application and pay a nominal fee to commence their pre-licensing training and licensing examination preparation programs and, depending on the state or province, to cover their licensing exam registration costs, which are generally paid by the Company. Recruits are not obligated to purchase any of the products we offer in order to become independent sales representatives, though they may elect to make such purchases.
Recruits may become our clients or provide us with access to their friends, family members and personal acquaintances. We continually work to improve our systematic approach to recruiting and training new independent sales representatives.
Similar to other distribution systems that rely upon part-time independent sales representatives and typical of the life insurance industry in general, we experience wide disparities in the productivity of individual independent sales representatives. Many new recruits do not get licensed, often due to the time commitment required to obtain licenses and various regulatory and licensing hurdles. Many licensed independent sales representatives are only marginally active, as there are no minimum life insurance production requirements. We plan for this disparate level of productivity and view a continuous recruiting cycle as a key component of our distribution model. Our distribution model is designed to address the varying productivity associated with independent sales representatives by paying production-based compensation, emphasizing recruiting, and developing initiatives to address barriers to licensing new recruits. By providing commissions to independent sales representatives on the sales generated by their sales organization, our compensation structure aligns the interests of independent sales representatives with our interests in recruiting new representatives and creating sustainable sales production.
The following table provides information on new recruits and life insurance-licensed independent sales representatives:
|
|
Year ended December 31, |
|
|||||||||
|
|
2023 |
|
|
2022 |
|
|
2021 |
|
|||
Number of new recruits |
|
|
361,925 |
|
|
|
359,735 |
|
|
|
349,374 |
|
Number of newly life insurance-licensed independent sales representatives |
|
|
49,096 |
|
|
|
45,147 |
|
|
|
39,622 |
|
Number of life insurance-licensed independent sales representatives, at period end |
|
|
141,572 |
|
|
|
135,208 |
|
|
|
129,515 |
|
Average number of life insurance-licensed independent sales representatives during period |
|
|
137,760 |
|
|
|
132,077 |
|
|
|
131,315 |
|
We define new recruits as individuals who have submitted an independent business application to become independent sales representatives together with payment of the nominal fee to commence their pre-licensing training. Certain recruits may not meet the compliance standards to become an independent sales representative, and others elect to withdraw prior to becoming actively engaged.
On average, it takes approximately three months for independent sales representatives to complete the necessary applications and pre-licensing coursework and to pass the applicable state or provincial examinations to obtain a license to sell term life insurance products. As a result, individuals recruited to become independent sales representatives within a given fiscal period may not become licensed independent sales representatives or meet compliance standards until a subsequent period.
Sales Force Motivation, Training, Communication and Sales Support Tools
Motivating, training and communicating with the independent sales force, as well as sales support tools, are critical to our success and that of the independent sales force.
Motivation. Through our proven system of sales force recognition events, contests and communications, we provide incentives that motivate our independent sales force. Motivation is driven largely by independent sales representatives’ desire to achieve higher levels of financial success by building their own businesses. The opportunity to help underserved middle-income households address financial challenges is also a source of motivation for many independent sales representatives.
While the RVPs are responsible for motivating the independent sales representatives in their own organizations, we provide a system that motivates independent sales representatives to succeed in their businesses by:
In 2022, we hosted our biennial international convention, which was attended by approximately 35,000 people, at the Mercedes-Benz Stadium in Atlanta, Georgia. New recruits and independent sales representatives who attended our convention and associated meetings
4
do so at their own expense, which we believe further demonstrates their commitment to our organization and mission. We are planning to hold our next biennial international convention in July 2024 at the Mercedes-Benz Stadium.
Training, Communication and Sales Support Tools. Primerica Online (“POL”), delivered through a secure Intranet website and a cross-platform mobile application (“Primerica App”) is our primary tool designed to support independent sales representatives and assist them in building their own businesses. We provide independent sales representatives with communication, training, and sales support tools on POL that allow both new and experienced sales representatives to offer financial information and products to our clients. POL provides independent sales representatives with access to various business tracking and management tools, licensing support tools, product-specific training, and sales procedures and tools. Additionally, POL provides access to internal training programs and videos covering sales, management skills, business ownership, and compliance. We also use POL to provide real-time recognition of independent sales representatives’ successes and scoreboards for independent sales force production, contests, and leadership trips. In addition, POL is a gateway to our product providers and product support. Subscribers generally pay a small monthly fee to subscribe to POL, which helps cover the cost of developing new resources and maintaining this support system. A limited version of POL that provides access to Primerica e-mail, compliance and compensation information, newsletters and bulletins is available at no cost to the independent sales force.
The primary features and tools available on POL include:
5
In addition, our publications department produces materials to support, motivate and inform the independent sales force. We sell recruiting materials, sales brochures, business cards and stationery and provide communications services that include web design, print presentations, graphic design and script writing. We also produce a weekly mailing that includes materials promoting our current incentives as well as the latest news about our product offerings.
Performance-Based Compensation Structure
Our commission structure is rooted in our origin as an insurance agency. Sales representatives, who are independent contractors, can receive compensation in multiple ways, including:
Our compensation structure pays commissions to the independent sales representative who sells the product and to several representatives above the selling representative within their sales organization.
With respect to term life insurance sales, commissions are calculated based on the total first-year premium (excluding the policy fee) for all policies and riders. To motivate the independent sales force, we compensate independent sales representatives for term life insurance product sales as quickly as possible. We advance a majority of the insurance commission upon the submission of a completed application and the first month’s premium payment. As the client makes his or her premium payments, the commission is earned by the independent sales representative and the commission advance is recovered by the Company. If premium payments are not made by the client and the policy terminates, any outstanding advance commission is charged back to the independent sales representative. The chargeback, which only occurs in the first year of a policy, equals that portion of the advance that was made, but not earned, by the independent sales representative because the client did not pay the full premium for the period of time for which the advance was made to the independent sales representative. Chargebacks, which occur in the normal course of business, may be recovered by reducing any cash amounts otherwise payable by the Company to the independent sales representative.
Independent sales representatives and representatives above them in their sales organizations are contractually obligated to repay us any commission advances that are ultimately not earned due to the underlying policy lapsing prior to the full commission being earned. Additionally, we hold back a portion of the commissions earned by independent sales representatives as a reserve out of which we may recover chargebacks. The amounts held back are referred to as deferred compensation account commissions (“DCA commissions”). DCA commissions are available to reduce amounts owed to the Company by independent sales representatives and they provide an independent sales representative with a cushion against the chargeback obligations of representatives in their sales organization. DCA commissions, unless applied to amounts owed, are ultimately released to independent sales representatives.
We pay most term life insurance commissions during the first policy year. One of our term riders provides for coverage increases after the first year. For such riders, we pay first-year and renewal commissions only for premium increases related to the increased coverage. Additionally, we pay renewal commissions on some older in-force policies. At the end of a policy’s level premium paying period, we pay commissions on policy exchanges and bonuses on some policy exchanges and continuations.
We also pay bonuses as a percentage of premiums to RVPs with respect to sales of term life policies and riders, up to a maximum premium. Bonuses are paid to RVPs for achieving specified production levels.
For U.S. mutual funds (non-managed investments) and annuity products, commissions are paid both on the sale and on the value of assets under management. Commissions are calculated based on the dealer reallowance and trail compensation actually paid to us. For managed investment products, fees earned are based on the assets under management and represent the fee we receive as compensation for as long as we retain the account. In July 2022, we began offering a series of mutual funds in Canada whereby independent sales representatives who earn monthly fees based on client asset values (the “asset-based fees”) have the option of receiving up-front compensation from PFSL Investments Canada based on the amount invested with reduced asset-based fees for a period of five years, and they are able to negotiate with an investor to earn a front-end load sales commission. If independent sales representatives choose to receive up-front compensation from PFSL Investments Canada, they are subject to a chargeback of the up-front compensation on a declining scale if the investor redeems some or all of the investment within five years. For our Canadian segregated fund investment products, we pay independent sales representatives a sales commission based on the amount invested and a monthly fee based on client asset values. As a result of Canadian regulatory changes that became effective in June 2023, we no longer pay an up-front sales commission on new segregated fund contracts and only pay a monthly fee based on client asset values. For further details of these regulatory changes, refer to the “Regulatory Changes” section in “Item 7. Management’s Discussion and Analysis of Financial Condition and Results of Operations”.
6
Primerica compensates Primerica Senior Health certified independent sales representatives with fees for services provided, including education and related services associated with introducing eligible Medicare beneficiaries to e-TeleQuote.
We also pay the independent sales force for mortgage originations, sales of prepaid legal services subscriptions, and referrals for other distributed products. Mortgage originations compensation paid to the independent sales force is earned for each closed mortgage loan based on a percentage of the loan amount, subject to regulatory maximums. Prepaid legal services commissions paid to the independent sales force are earned in fixed amounts on a monthly basis as long as the prepaid legal service subscription remains active. Compensation related to other distributed products is calculated based on the type of product sold or referred.
In addition to these methods of compensation, RVPs can earn quarterly agent equity awards based largely on sales production.
Sales Force Licensing and Support
The states, provinces and territories in which independent sales representatives operate generally require them to obtain and maintain licenses to sell our insurance and securities products, which requires them to pass applicable examinations. Independent sales representatives may also be required to maintain licenses to sell certain of our other distributed products. To encourage new recruits to obtain their life insurance licenses, we either pay directly or reimburse the independent sales representative for certain licensing-related fees and expenses once he or she passes the applicable exam and obtains the applicable life insurance license. In addition, new recruits are eligible to earn compensation if they participate in field training observations with experienced independent sales representatives and complete the licensing process within a specified timeframe. To sell insurance products, independent sales representatives must be licensed by their resident state, province or territory and by any other state, province or territory in which they do business. In most states, independent sales representatives must also be appointed by our applicable insurance subsidiary. Our in-house life insurance licensing program offers new recruits a significant number of classroom life insurance pre-licensing courses to meet applicable state and provincial licensing requirements and prepares recruits to pass applicable licensing exams.
To sell mutual funds and variable annuity products, U.S. sales representatives must be registered with the Financial Industry Regulatory Authority (“FINRA”) and hold the appropriate license(s) designated by each state in which they sell securities products, as well as be appointed by the annuity underwriter in the states in which they market annuity products. Sales representatives must meet all state and federal regulatory requirements and be designated as an investment advisor representative in order to sell our managed investment products. We contract with third-party training firms to conduct securities license exam preparation for sales representatives, and we also offer supplemental training tools.
Canadian independent sales representatives selling mutual fund products are required to be registered by the securities regulators in the provinces and territories in which they sell mutual fund products. Canadian independent sales representatives who are licensed to sell our insurance products do not need any further licensing to sell our segregated funds products.
In most states, Primerica’s independent sales representatives can become certified to make Senior Health referrals by completing an internal training and brief certification course. Upon completion of the certification process, Primerica’s independent sales representatives may educate eligible beneficiaries about Medicare in general, refer them to an e-TeleQuote licensed health insurance agent and provide certain other related services.
To offer mortgage loan products in the United States, independent sales representatives must be individually licensed as mortgage loan originators by the states in which they do business and, in some states, they must also be individually licensed as mortgage brokers.
For sales of our other distributed products, appropriate state, provincial and territorial licensing may be required.
Supervision and Compliance
To ensure compliance with various federal, state, provincial and territorial legal requirements, we and the RVPs share responsibility for maintaining an overall compliance program that involves compliance training and supporting, as well as monitoring, the activities of independent sales representatives. We work with the RVPs to develop and maintain appropriate compliance procedures and systems.
Generally, RVPs must obtain a principal license (FINRA Series 26 in the United States and Branch Manager license in Canada), and, as a result, they assume additional regulatory responsibility over the activities of their sales organizations. Additional supervision is provided by designated principal-licensed home office personnel, referred to as Regional Securities Principals (“RSP”). RSPs are required to supervise and monitor activity across all product lines and report any compliance issues they observe to our Compliance Department. In addition, our Compliance Department regularly runs surveillance reports designed to monitor the activity of the independent sales force and investigates any unusual or suspicious activity identified during these reviews or during periodic inspections of RVP offices.
All independent sales representatives are required to participate in our annual compliance meeting, a program administered by our senior management and our legal and compliance staff. We provide a compliance training overview across all product lines and
7
require the completion of compliance checklists by each licensed independent sales representative for each product he or she offers. Additionally, independent sales representatives receive periodic compliance communications, both in writing and through videos, regarding new compliance developments and business issues of significance.
Our Field Audit Department regularly conducts audits of all sales representative offices, including scheduled and no-notice audits when feasible. Our Field Audit Department reviews regulatory-required records that are not maintained at our home office. Any compliance deficiencies noted in the audit must be corrected, and we carefully monitor all corrective action. Audit deficiencies are addressed through reprimands, probations and contract terminations.
Senior Health Distribution
In the United States, our subsidiary e-TeleQuote distributes Medicare-related insurance products to eligible Medicare beneficiaries and enrolls them in coverage utilizing e-TeleQuote’s team of licensed health insurance agents. e-TeleQuote’s licensed health insurance agents are employees of e-TeleQuote. These licensed health insurance agents utilize both third-party and e-TeleQuote’s proprietary technology, including telephony, relationship management, lead analytics, and plan comparison tools, to enroll beneficiaries in eligible Medicare plans.
e-TeleQuote’s licensed health insurance agents are full-time employees who are motivated through compensation systems that track performance and reward them accordingly. This compensation system includes an hourly wage plus an incentive compensation component based on individual sales performance and key performance indicators, which include policy retention. We provide sales support through the sourcing and screening of leads, allowing our licensed health insurance agents to maximize time spent with potential enrollees, as well as through technology that provides relationship management, lead analytics, and plan comparisons for licensed health insurance agents to facilitate the enrollment of beneficiaries in eligible Medicare plans. e-TeleQuote manages the licensing, certification and training process through its dedicated health insurance licensing team and technology platform for regulatory compliance. Continuing education is provided annually to ensure that our licensed health insurance agents are up to date with carrier updates, compliance and technology.
In order to market Medicare-related insurance products, e-TeleQuote’s licensed health insurance agents are required to hold a state-issued license to market health insurance products within that state. Each agent holds a resident license from the state in which they are based and acquires non-resident licenses for each of the other states in which they conduct business. In order to obtain an initial resident license, prospective e-TeleQuote licensed health insurance agents are required to complete online or classroom training and pass a comprehensive state licensing exam covering health insurance product features and benefits, risk management and health insurance regulations. Non-resident licenses are issued by states on the basis of reciprocity as long as the agent is in good standing with their resident state, as well as upon payment of a license fee.
Once licensed to sell health insurance by state agencies, e-TeleQuote’s licensed health insurance agents need to be certified annually by a health insurance carrier to sell that carrier’s products. State law may also require agents to be appointed by a health insurance carrier as the carrier’s agent. Such certification involves online classes and testing for subject matters such as the basics of Medicare, fee-for-service plan eligibility and benefits, different types of plans, enrollment processes and requirements, marketing compliance, anti-money laundering, fraud, waste, and abuse detection and reporting. The certification process can take up to 40 hours of classes and testing before an agent will be allowed to sell Medicare plans.
e-TeleQuote has developed an internal regulatory compliance system that tracks requirements for agent licensing, agent continuing education, agent appointment by carrier, carrier mandated certifications and Centers for Medicare and Medicaid Services (“CMS”) mandated certifications. e-TeleQuote’s compliance officer manages, implements, and oversees all aspects of agent compliance, including the quality assurance testing of sales calls.
Our Product Offerings
Reflecting our philosophy of helping middle-income clients with their financial services needs and ensuring compatibility with our distribution model, our product offerings generally meet the following criteria:
We use four operating segments to organize, evaluate and manage our business: Term Life Insurance; Investment and Savings Products; Senior Health; and Corporate and Other Distributed Products.
8
The following table provides information on our principal product offerings and the principal sources thereof by operating segment as of December 31, 2023.
Operating Segment |
|
Principal Product Offerings |
|
Principal Sources of Products |
Term Life Insurance |
|
Term Life Insurance |
|
Primerica Life (U.S. (except New York) and certain territories) |
|
|
|
|
NBLIC (New York) |
|
|
|
|
Primerica Life Canada (Canada) |
Investment and Savings Products |
|
Mutual Funds and Certain Retirement Plans |
|
American Century Investments (U.S.) |
|
|
|
|
American Funds (U.S.) |
|
|
|
|
Equitable Distributors, LLC (U.S.) |
|
|
|
|
Nuveen, LLC (U.S.) |
|
|
|
|
VOYA Financial, Inc. (U.S.) |
|
|
|
|
Fidelity Investments (U.S.) |
|
|
|
|
Franklin Templeton Investments (U.S.) |
|
|
|
|
Invesco (U.S.) |
|
|
|
|
AGF Investments (Canada) |
|
|
|
|
Mackenzie Investments (Canada) |
|
|
Managed Investments |
|
PFS Investments (dba Primerica Advisors) (as a program sponsor) (U.S.) |
|
|
Variable Annuities |
|
Corebridge Financial, Inc. (U.S.) |
|
|
|
|
Brighthouse Financial, Inc. (U.S.) |
|
|
|
|
Equitable Distributors, LLC (U.S.) |
|
|
|
|
Lincoln National Corporation (U.S.) |
|
|
Fixed Indexed Annuities |
|
Corebridge Financial, Inc. (U.S.) |
|
|
|
|
Lincoln National Corporation (U.S.) |
|
|
|
|
Universal Life Insurance Company (Puerto Rico) |
|
|
Fixed Annuities |
|
Universal Life Insurance Company (Puerto Rico) |
|
|
Employer Sponsored Retirement Plans |
|
American Funds (U.S.) |
|
|
|
|
Equitable Distributors, LLC (U.S.) |
|
|
|
|
VOYA Financial, Inc. (U.S.) |
|
|
Segregated Funds |
|
Primerica Life Canada (Canada) |
Senior Health |
|
Medicare Advantage and Medicare Supplement Plans |
|
Aetna Inc. (U.S.) |
|
|
|
|
Elevance Health, Inc. (U.S.) |
|
|
|
|
Cigna, Inc. (U.S.) |
|
|
|
|
Humana, Inc. (U.S.) |
|
|
|
|
Mutual of Omaha (U.S.) |
|
|
|
|
UnitedHealthcare Group, Inc. (U.S.) |
Corporate and Other Distributed |
|
Mortgage Loans (1)(2) |
|
Rocket Mortgage, LLC (U.S.) |
|
|
|
|
Spring EQ LLC (U.S.) |
|
|
|
|
Rocket Mortgage Canada ULC (Canada) |
|
|
|
|
8Twelve Mortgage Corp. (Canada) |
|
|
Prepaid Legal Services |
|
Pre-Paid Legal Services, Inc. (U.S. and Canada) |
|
|
ID Theft Defense |
|
Pre-Paid Legal Services, Inc. (U.S. and Canada) |
|
|
Supplemental Health and Accidental Death & |
|
The Edge Benefits Inc. and its affiliates (Canada) |
|
|
Auto and Homeowners' Insurance (2) |
|
Various insurance companies, as offered through |
|
|
|
|
SurexDirect.com Ltd. (Canada) |
|
|
Home Automation Solutions |
|
Vivint, Inc. (U.S.) |
Term Life Insurance
Through our three life insurance subsidiaries – Primerica Life, NBLIC and Primerica Life Canada – we offer term life insurance to clients in the United States, its territories, the District of Columbia and Canada. As of the third quarter of 2023, the latest period for which data is available from LIMRA, we ranked as a leading provider of individual term life insurance in the United States.
9
We believe that term life insurance is generally a better alternative for middle-income clients than cash value life insurance. Term life insurance provides a guaranteed death benefit if the insured dies during the fixed coverage period of an in-force policy, thereby providing financial protection for his or her named beneficiaries in return for the periodic payment of premiums. Term insurance products, which are sometimes referred to as pure protection products, have no savings or investment features. By buying term life insurance rather than cash value life insurance, a policyholder pays a lower premium over the level term period and, as a result, may have funds available to invest for retirement and other needs. We also believe that a person’s need for life insurance is inversely proportional to that person’s need for retirement savings, a concept we refer to as the theory of decreasing responsibility. Young adults with children, new mortgages and other obligations need to buy higher amounts of insurance to protect their family from the loss of future income resulting from the death of a primary earner. With its lower premium over the level term period, term life insurance lets young families buy more coverage for their premium dollar when their needs are greatest and still have the ability to have funds for their retirement and other savings goals.
We design our term life insurance products to be easily understood by, and meet the needs of, our clients. Clients purchasing our term life insurance products generally seek stable, longer-term income protection products for themselves and their families. In response to this demand, we offer term life insurance products with initial level-premium coverage periods that range from 10 to 35 years and a wide range of coverage face amounts. Policies remain in-force until expiration of the coverage period or until the policyholder ceases to make premium payments and terminates the policy. Our in-force term life insurance policies have level premiums for the stated term period. As such, the policyholder pays the same amount each year. After the initial policy term, the policyholder has the option to continue coverage by renewing or exchanging their contract. Both options result in higher premiums due to the policyholder’s more advanced age.
In October 2022, we introduced our new generation of life insurance products in all jurisdictions except New York where we continue to sell our legacy term life insurance products. The Primerica PowerTerm (“PowerTerm”) product is our rapid issue term life product that provides for face amounts of up to $300,000 (local currency). PowerTerm allows an independent sales representative to submit an application via TurboApps, during which the Company collects information compliant with the Fair Credit Reporting Act (“FCRA”) from external data sources to inform the underwriting process. The Company uses this data and the client’s responses to application questions to determine any additional underwriting requirements. Results of these processes are reported in real time to our underwriting system, which then determines whether or not we can rapidly issue a policy.
We also offer our Primerica PrecisionTerm (“PrecisionTerm”) product, which is our traditionally underwritten term insurance product for face amounts in excess of $150,000 (local currency). PrecisionTerm allows an independent sales representative to submit an application via TurboApps. The Company then collects information from external data sources that are traditional in nature, excluding credit scores. Most applicants are required to undergo traditional paramedical testing requirements to complete the underwriting process; however, certain applicants may have testing waived based on application and external data information. Policies with face amounts less than or equal to $300,000 and greater than $150,000 may be issued as either PowerTerm or PrecisionTerm products depending on the underwriting method the insured prefers.
The average face amount of our in-force policies issued in 2023 was approximately $256,100. The following table sets forth the number of term life insurance policies issued:
|
|
Year ended December 31, |
|
|||||||||
|
|
2023(1) |
|
|
2022 |
|
|
Adjusted 2022 (estimated)(1) |
|
|||
Life insurance issued: |
|
|
|
|
|
|
|
|
|
|||
Number of policies issued |
|
|
358,860 |
|
|
|
291,918 |
|
|
|
333,020 |
|
The following table sets forth selected information regarding our term life insurance product portfolio:
|
|
Year ended December 31, |
|
|||||||||
|
|
2023 |
|
|
2022 |
|
|
2021 |
|
|||
Life insurance issued: |
|
|
|
|
|
|
|
|
|
|||
Face amount issued (in millions) |
|
$ |
119,102 |
|
|
$ |
103,822 |
|
|
$ |
108,521 |
|
|
|
|
|
|
|
|
|
|
|
|||
|
|
December 31, |
|
|||||||||
|
|
2023 |
|
|
2022 |
|
|
2021 |
|
|||
Life insurance in force: |
|
|
|
|
|
|
|
|
|
|||
Number of policies in force |
|
|
2,959,006 |
|
|
|
2,896,667 |
|
|
|
2,885,963 |
|
Face amount in force (in millions) |
|
$ |
944,609 |
|
|
$ |
916,808 |
|
|
$ |
903,404 |
|
10
Pricing and Underwriting. We believe that effective pricing and underwriting are significant drivers of the profitability of our life insurance business and we have established our pricing assumptions to be consistent with our underwriting practices. We set pricing assumptions for expected claims, lapses and expenses based on our experience and other factors, while also considering the competitive environment. These other factors include:
Under our current underwriting guidelines, we individually assess each insurable adult applicant and place each applicant into one of ten risk classifications that has specific criteria based on current health, medical history, and other risk factors. We may decline an applicant’s request for coverage if his or her health or activities create unacceptable risks. Our PowerTerm and PrecisionTerm products cover one adult life per policy, which is a change from our historical term life products which offered family coverage with multiple lives on an individual policy.
Independent sales representatives ask applicants a series of questions regarding the applicant’s medical history and other risk factors. We may also consider information about the applicant from FCRA compliant third-party sources. If we believe that further information regarding an applicant’s medical history is necessary, we use a third-party provider and its trained personnel to contact the applicant to obtain a more detailed medical history. The report resulting from this process is electronically transmitted to us and is evaluated in our underwriting process. Paramedical requirements may also be required.
To accommodate the significant volume of insurance business that we process, we and the independent sales force use specialized technology. We offer independent sales representatives an electronic life insurance application that supports our term life insurance products. Approximately 99% of the life insurance applications we received in 2023 were submitted electronically via TurboApps. Independent sales representatives may utilize video collaboration tools to assist with the completion of the life insurance application and submit completed applications through TurboApps. Our PowerTerm and PrecisionTerm electronic life insurance applications have technology to streamline the application process and deliver a superior experience by using industry-standard security, identity verification (in the U.S. only), precise and real-time underwriting to speed up processing time and reduce errors in submitted applications. Electronic disclosure delivery and digital client signatures through third-party technology, seamless banking information importation, and simple policy language provide a convenient client experience.
Claims Management. Our insurance subsidiaries processed over 18,800 life insurance benefit claims in 2023 on policies underwritten by us and sold by independent sales representatives. During the COVID-19 pandemic, we experienced elevated claims due to the premature deaths of our insureds. Beginning in early 2022, we experienced fewer COVID-19 related claims than during the height of the pandemic. For additional information regarding the impact of COVID-19 on our claims expense, the related reinsurance effects, and policyholder persistency, see “Item 7. Management’s Discussion and Analysis of Financial Condition and Results of Operations” included elsewhere in this report.
Claims fall into three categories: death, waiver of premium (applicable to disabled policyholders who purchased this benefit for which we agree to waive life insurance premiums during a qualifying disability), or terminal illness. The claim may be reported by an independent sales representative, a beneficiary or, in the case of qualifying disability or terminal illness, the policyholder. Following are the benefits paid by us for each category of claim:
|
|
Year ended December 31, |
|
|||||||||
|
|
2023 |
|
|
2022 |
|
|
2021 |
|
|||
|
|
(In thousands) |
|
|||||||||
Death |
|
$ |
1,779,822 |
|
|
$ |
1,903,179 |
|
|
$ |
2,245,614 |
|
Waiver of premium |
|
|
53,758 |
|
|
|
55,394 |
|
|
|
54,465 |
|
Terminal illness (1) |
|
|
16,433 |
|
|
|
16,044 |
|
|
|
11,635 |
|
In the United States, after coverage has been in force for two years, we may not contest the policy for misrepresentations in the application. The contestability period for suicide of the insured is one to two years depending on state regulation. In Canada, we have a similar two-year contestability period, but we are permitted to contest insurance fraud at any time. As a matter of policy, we do not contest any coverage issued by us to replace the face amount of another insurance company’s individual coverage to the extent the replaced coverage would not be contestable by the replaced company. We believe this approach helps independent sales representatives sell replacement policies, as it reassures clients that claims made under their replacement policies are not more likely to be contested as to the face amount replaced. Through our claims administration system, we record, process and pay the appropriate benefit for any reported claim. Our claims system is used by our home office claims adjusters to order medical and investigative
11
reports from third-party providers, calculate amounts due to the beneficiary (including interest), and report payments to the appropriate reinsurance providers.
Primerica Life and NBLIC regularly consult the Social Security Administration’s Death Master File in accordance with applicable state requirements. These processes help identify potential deceased insureds for whom claims have not been presented in the normal course of business. If unreported deaths are identified, Primerica Life and NBLIC attempt to determine if a valid claim exists, to locate beneficiaries, and to pay benefits accordingly.
Reinsurance. We use reinsurance primarily to reduce the volatility risk with respect to mortality. Since 1994, we have reinsured death benefits in the United States on a first dollar quota share yearly renewable term basis. Since 2012, we have reinsured death benefits in Canada on a first dollar quota share yearly renewable term basis. We pay premiums to each reinsurer based on rates in the applicable agreement.
We generally reinsure between 80% and 90% of the mortality risk for all term life insurance policies, excluding coverage under certain riders. We also reinsure substandard cases on a facultative basis to capitalize on the extensive experience some of our reinsurers have with substandard cases. A substandard case has a level of risk that is acceptable to us, but at higher premium rates than a standard case because of the health, habits or occupation of the applicant.
While most of our reinsurance agreements have indefinite terms, both we and our reinsurers are entitled to discontinue any reinsurance agreement as to future policies by giving advance notice of 90 days to the other. Each reinsurer’s ability to terminate coverage for existing policies is limited to circumstances such as a material breach of contract or nonpayment of premiums by us. Each reinsurer has the right to increase rates with certain restrictions. If a reinsurer increases rates, we have the right to immediately recapture the business. Either party may offset any balance due from the other party. For additional information on our reinsurance, see Note 1 (Description of Business, Basis of Presentation, and Summary of Significant Accounting Policies) and Note 6 (Reinsurance) to our consolidated financial statements included elsewhere in this report.
Financial Strength Ratings. Ratings with respect to financial strength are an important factor in establishing our competitive position and maintaining public confidence in us and our ability to market products. Ratings organizations review the financial performance and condition of most insurers and provide opinions regarding financial strength, operating performance and ability to meet obligations to policyholders. For additional information, see “Item 7. Management’s Discussion and Analysis of Financial Condition and Results of Operations – Liquidity and Capital Resources – Financial Ratings.”
Investment and Savings Products
We believe that many middle-income families have significant unmet retirement and savings needs. Independent sales representatives help our clients understand their current financial situations and how they can use time-tested financial principles, such as prioritizing personal savings, to reach their savings goals. Our product offerings include saving and investment vehicles that seek to meet the needs of clients in all stages of life.
Through PFS, PFS Investments, Primerica Life Canada, PFSL Investments Canada, and licensed sales representatives, we distribute and sell to our clients a variety of investment products: mutual funds; managed investments; variable, index-linked, fixed and fixed indexed annuities; and segregated funds. As of December 31, 2023, approximately 25,272 sales representatives were licensed to distribute mutual funds in the United States (including Puerto Rico) and Canada. As of December 31, 2023, approximately 13,420 sales representatives were licensed and appointed to distribute annuities in the United States and approximately 10,087 sales representatives were licensed to sell segregated funds in Canada.
Mutual Funds. In the United States, licensed sales representatives primarily distribute mutual funds from selected asset management firms that are on our proprietary platform. The selected firms have diversified product offerings, including domestic and international equity, fixed-income and money market funds. Each firm continually evaluates its fund offerings and adds new funds on a regular basis. Additionally, their product offerings reflect diversified asset classes and varied investment styles. We believe that these selected asset management firms provide funds that meet the investment needs of our clients.
During 2023, Franklin Templeton, Invesco, American Funds and Fidelity collectively accounted for approximately 98% of our mutual fund sales in the United States. Franklin Templeton and Invesco each have large wholesaling teams that support the sales force in distributing their mutual fund products. Our selling agreements with these firms all have indefinite terms and provide for termination at will.
A wholly owned indirect subsidiary of the Parent Company and affiliate of PFS Investments, Primerica Shareholder Services, Inc. (“PSS”), provides transfer agent recordkeeping services to investors who purchase shares of mutual funds offered by certain of our fund families through PFS Investments. In exchange for these services, PSS receives recordkeeping and account maintenance fees from the applicable fund company. PSS has retained BNY Mellon Asset Servicing to perform the necessary transfer agent recordkeeping services for these accounts on its proprietary SuRPAS system. PFS Investments serves as the Internal Revenue Service (“IRS”) approved non-bank custodian for customers that open individual retirement accounts (“IRAs”) (or certain other retirement
12
accounts) with PFS Investments and invest in shares of mutual funds offered by certain of our fund families. For these services, PFS Investments receives an annual custodian fee.
As a result of Canadian regulatory changes, in July 2022 PFSL Investments Canada’s services became focused on acting as the exclusive principal distributor for two families of mutual funds (the "PD Funds") that are managed by well-established, unrelated investment fund managers. The PD Funds are: (i) the AGF Platform Funds, which consist of a range of mutual funds managed by AGF Investments Inc. (“AGF”); and (ii) the Mackenzie FuturePath Funds, which consist of a range of mutual funds managed by Mackenzie Financial Corporation. PFSL Investments Canada has an exclusive right to distribute the PD Funds and, as a principal distributor, it markets the PD Funds through its representatives. PFSL Investments Canada representatives no longer recommend other mutual funds (the “Legacy Canada Mutual Funds”) that were previously available for purchase through PFSL Investments Canada. Like our U.S. fund family, the PD Funds asset management partners we have chosen in Canada have a diversified offering of equity, fixed-income and money market funds, including domestic and international funds with a variety of investment styles. The regulatory changes continue to be examined by Canadian regulators and may be modified.
In addition to the PD Funds, under limited circumstances, PFSL Investments Canada can offer investments in the Legacy Canada Mutual Funds, which include the Primerica-branded Concert™ Series funds and other non-proprietary funds. PFSL Fund Management is the Investment Fund Manager of the Concert™ Series funds. These limited circumstances primarily consist of pre-authorized purchases made pursuant to a systemic investment plan for existing clients. Our Concert™ Series funds consist of five different asset allocation funds and a money market fund with varying investment objectives. Each Concert™ Series fund is a fund of funds that allocates fund assets among equity, income and money market mutual funds of AGF. The asset allocation within each Concert™ Series fund is determined on an advisory contract basis by an independent portfolio adviser.
A key part of our investment philosophy for our clients is the long-term benefits of dollar cost averaging through systematic investing. To accomplish this, we assist our clients by facilitating monthly contributions to their investment accounts by bank drafts against their checking accounts for as little as $25 per month. During the year ended December 31, 2023, average client assets held in individual retirement accounts in the United States and Canada accounted for an estimated 73% and 65% of total average client account assets, respectively. The Canadian counterpart to IRAs in the United States are Registered Retirement Savings Plans (“RRSPs”). RRSPs and IRAs behave similarly, providing tax advantaged treatment and enabling clients to earn income on a tax-deferred basis. Our high concentration of retirement plan accounts and our systematic savings philosophy are beneficial to us as these accounts tend to have lower redemption rates than the industry and, therefore, generate more recurring asset-based revenues.
Managed Investments. PFS Investments (dba Primerica Advisors) is a registered investment advisor in the United States, and it offers a managed investments program, Primerica Advisors Lifetime Investment Program (the “Lifetime Investment Program”), which we launched in 2017. The Lifetime Investment Program is a robust advisory offering designed for clients who have at least $25,000 of investable assets. It provides our customers access to investment models designed and managed by several unaffiliated investment advisers. PFS Investments, as sponsor and portfolio manager of the program, evaluates models for inclusion in the program and conducts ongoing due diligence of the models and unaffiliated investment advisers made available through the program. As of December 31, 2023, we used 11 unaffiliated investment advisers. Primerica Brokerage Services, Inc. (“PBSI”), a wholly owned affiliate of Primerica, is the introducing broker-dealer for customer accounts managed through the Lifetime Investment Program. Pershing LLC (“Pershing”), an unaffiliated clearing firm, provides custody, trade execution, clearing, settlement and related services through a fully disclosed clearing agreement with PBSI.
Variable Annuities. U.S. securities licensed sales representatives also distribute variable annuities issued by American General Life Insurance Company and its affiliates (“Corebridge”), Equitable Financial Life Insurance Company (“Equitable Life”), Lincoln National Life Insurance Company and its affiliates (“Lincoln National”) and Brighthouse Life Insurance Company (“Brighthouse Life”). Variable annuities are insurance products that enable our clients to invest in accounts with attributes similar to mutual funds, but also have benefits not found in mutual funds, including death benefits that protect beneficiaries from losses due to a market downturn and income benefits that guarantee future income payments for the life of the policyholder(s). We also offer index-linked annuities issued by Equitable Life, Brighthouse Life and Lincoln National. Index-linked annuities are insurance contracts that provide investors with potential growth, subject to a cap, and partial downside protection against losses. Gains and losses are measured over a fixed period, typically three to six years, based on the performance of a securities index. Although linked to an index, an investment in these contracts does not involve ownership of any underlying portfolio securities by the client. Each of these companies bears the insurance risk on its variable annuities and index-linked variable annuities that we distribute.
Fixed Indexed Annuities. We offer fixed indexed annuity products in the U.S. through Lincoln National, Corebridge and Universal Life Insurance Company (“Universal Life”) (Puerto Rico). These products combine safety of principal and guaranteed rates of return with additional investment options tied to equity market indices that allow for returns that move based on the performance of an index. We believe these and other fixed annuity products give both life and securities representatives more ways to assist our clients with their retirement planning needs.
Fixed Annuities. In Puerto Rico, we currently offer two annuity products: a fixed annuity and a fixed bonus annuity underwritten by Universal Life. These products provide guarantees against loss with several income options.
13
Employer-Sponsored Retirement Plans. In the United States, we also offer Employer Sponsored Retirement Plans (“ESRP”), such as 401(k) plans, primarily to small and medium-sized businesses. The ESRPs we distribute are offered by a limited number of third-party providers, including American Funds Distributors, Inc., Equitable Distributors, LLC and VOYA Financial, Inc., which together account for most of our ESRP business. In addition, we distribute 457(b) plans to governmental entities. Our licensed representatives generally provide educational and administrative services with respect to ESRPs, which include helping our ESRP clients understand the benefits of offering a tax-deferred retirement plan and assisting their employees to realize the need to save for retirement and the benefits of doing so in an ESRP.
Segregated Funds. In Canada, we underwrite segregated fund products, branded as our Common Sense FundsTM, that have some of the characteristics of our variable annuity products distributed in the United States. Our Common Sense FundsTM are underwritten by Primerica Life Canada and offer our clients the ability to participate in a diversified managed investments program that can be opened for as little as $25. While the assets and corresponding liability (reserves) are recognized on our consolidated balance sheets, the assets are held in separate accounts for the benefit of the segregated fund contract owners and are not commingled with the general assets of the Company.
There are three fund products within our segregated funds: the Asset Builder Funds, the Strategic Retirement Income Fund (“SRIF”), and a money market fund known as the Cash Management Fund. The investment objective of Asset Builder Funds is long-term capital appreciation combined with some guarantee of principal. Unlike mutual funds, our Asset Builder Funds product guarantees clients at least 75% of their net contributions (net of withdrawals) at the earlier of the date of their death or at the Asset Builder Funds’ maturity date, which is selected by the client. The portfolio consists of both equities and fixed-income securities with the equity component consisting of a pool of primarily large cap Canadian and U.S. equities and the fixed-income component consisting of Canadian federal government zero coupon treasuries and government-backed floating rate notes. The portion of the Asset Builder Funds’ portfolio allocated to zero coupon treasuries are held in sufficient quantity to satisfy the guarantees payable at the maturity date of each Asset Builder Fund. As a result, our potential loss exposure is very low as it comes from the guarantees payable upon the death of the client prior to the maturity date.
As a result of Canadian regulatory changes that became effective in June 2023, we no longer pay an up-front sales commission on new segregated fund contracts (subject to certain exceptions below) and independent sales representatives are paid a monthly fee based on client asset values. We may pay independent sales representatives a sales commission based on the amount invested under limited circumstances including (i) pre-authorized purchases and subsequent purchases for existing clients with existing Common Sense FundsTM contracts prior to the June 1, 2023 effective date and (ii) if any sales-based up-front commissions were negotiated between the investor and the independent sales representative.
The investment objective of the SRIF is to provide income during retirement plus the opportunity for modest capital appreciation. The SRIF product guarantees clients 75% of their net contributions (net of withdrawals) at the earlier of the date of their death or age 100. The portfolio consists of both equities and fixed-income securities, with the equities consisting of a pool of primarily large cap Canadian and U.S. equities that are capped at 25% of the portfolio. The balance is a fixed-income portfolio consisting of investment-grade government and corporate bonds. The high quality of the investments and the percentage cap on equities results in a relatively low potential loss exposure. All accounts in the SRIF are held as Registered Retirement Income Funds which carry government-mandated minimum annual withdrawals. Similar to the Asset Builder Funds, our potential exposure for loss associated with the SRIF is very low because its investment allocations are conservatively aligned with the risks of the client contracts.
The Cash Management Fund invests in government guaranteed short-term bonds and short-term commercial and bank papers, with the principal investment objective being the provision of interest income while maintaining liquidity and preserving capital.
With the guarantee level at 75% and in light of the time until the scheduled maturity of our segregated funds contracts, we currently do not believe it is necessary to allocate any corporate capital as reserves for segregated fund contract benefits.
Investment and Savings Products Revenue. In the United States, we earn revenue from our Investment and Savings Products business in three ways: up front commissions and payments earned on the sale of such products; trailing fees and payments earned based upon client asset values; and account-based revenue. On the sale of mutual funds (not including managed investments) and annuities, we earn a dealer re-allowance or commission on new purchases as well as trail commissions on the assets held in our clients’ accounts. We also receive marketing and distribution fees from most of our mutual fund and annuity providers. These payments are typically a percentage of sales or a percentage of the clients’ total asset values, or a combination of both. For investments into the Lifetime Investment Program, we receive an asset-based fee as compensation for the investment advisory and other administrative services we provide.
As the IRS-approved non-bank custodian for certain funds noted above, PFS Investments receives annual fees on a per-account basis for as long as it services the account. As explained above, PSS receives transfer agent recordkeeping fees for the services it provides to the fund families noted above in “Mutual Funds” section. An individual client account may include multiple fund positions for which we earn recordkeeping fees.
14
Because the total amount of these fees fluctuates with the number of such accounts and positions within those accounts, the opening or closing of accounts has a direct impact on our revenues. From time to time, the fund companies for which we provide these services request that accounts or positions with small balances be closed.
In Canada, we have historically earned revenue on our mutual fund offerings in two ways: up-front commissions from fund managers under the deferred sales charge compensation model (or dealer re-allowance) on mutual fund sales and fees paid based upon client asset values (mutual fund trail commissions and investment advisory fees from Concert™ Series funds). As a result of Canadian regulatory changes, a new business model for the distribution of mutual funds was adopted in July 2022, pursuant to which PFSL Investments Canada acts as the exclusive principal distributor for the PD Funds. In this new principal distributor model, PFSL Investments Canada earns revenue primarily in the form of fees paid based upon client asset values, which include dealer services fees that are paid monthly to us by clients and principal distributor fees which are paid to us on a periodic basis by the PD Fund managers. PFSL Investments Canada also has the opportunity to earn revenue from sales-based up-front commissions if such commissions are negotiated between investors and PFSL Investments Canada representatives. PFSL Investments Canada continues to earn revenue from Legacy Canada Mutual Funds in the form of up-front commissions on mutual fund sales (only if negotiated between our representative and the investor) and fees paid based upon client asset values. For our segregated fund products, we earn revenue primarily from fees paid based upon client asset values in the form of investment advisory fees. We may also earn deferred sales charges for early withdrawals at an annual declining rate within seven years of an investor’s original contribution for segregated funds contracts entered into prior to June 2023. As a result of certain Canadian regulatory changes that were effective in June 2023, we no longer offer new segregated funds contracts with deferred sales charges. For further details of these regulatory changes, refer to the “Regulatory Changes” section in “Item 7. Management’s Discussion and Analysis of Financial Condition and Results of Operations”.
Senior Health
In the United States, we distribute Medicare-related insurance products to eligible Medicare beneficiaries and enroll eligible Medicare beneficiaries in coverage utilizing licensed health insurance agents through our subsidiary, e-TeleQuote (dba easyMed Insurance Services). These products consist of Medicare Advantage Plans and Medicare Supplement Plans. Medicare Advantage Plans are insurance policies offered by private health insurance carriers approved by CMS. These policies are fully funded by the federal government and managed by private health insurance carriers. They cover hospital care, outpatient medical services and, in some cases, additional coverage for prescription drugs, vision, hearing and dental. Medicare Supplement Plans provide additional insurance to help pay for costs not covered by Medicare, such as copayments, coinsurance, deductibles and coverage for travel outside of the United States. Medicare Supplement Plans are private health insurance without any Medicare subsidy. During 2023, UnitedHealthcare Group, Inc., Humana, Inc., Aetna Inc., Cigna, Inc. and Elevance Health, Inc. accounted for the majority of the Senior Health segment’s commissions revenues.
e-TeleQuote earns commissions and fees when eligible Medicare beneficiaries are enrolled in plans offered by third-party health insurance carriers. We are entitled to commissions at the time the initial policy is approved by the health insurance carrier and renewal commissions for as long as the policy renews. Additionally, e-TeleQuote earns consideration related to certain services it provides for purposes of selling policies on behalf of health insurance carriers. The Senior Health segment experiences notable seasonality. For further details of this seasonality, refer to the “Senior Health Key Performance Indicators” section in “Item 7. Management’s Discussion and Analysis of Financial Condition and Results of Operations”.
Other Distributed Products
In the United States, we distribute other products, including mortgage loans through mortgage-licensed loan originators, prepaid legal services, auto and homeowners’ insurance referrals and home automation solutions. In Canada, we offer mortgage loan referrals, auto and homeowners’ insurance referrals and insurance offerings for small businesses. While some of these products are Primerica-branded, all of them are underwritten or otherwise provided by a third party.
We have a contractual arrangement with Rocket Mortgage, LLC (“Rocket Mortgage”), a mortgage lender, whereby Primerica Mortgage, LLC (“Primerica Mortgage”), a state-licensed mortgage broker, offers refinance mortgages and purchase-money mortgages through its mortgage loan originator licensed representatives. We also have a program with Spring EQ LLC, a mortgage lender, whereby Primerica Mortgage offers second mortgages and home equity lines of credit through its mortgage loan originator licensed representatives. In 2023, we continued to expand our mortgage program into new states.
We receive compensation from the mortgage lenders for each closed loan based on a fixed percentage of the loan amount (subject to regulatory maximums) for mortgage brokering services provided and pay compensation to the representatives for services rendered.
We offer our U.S. and Canadian clients a Primerica-branded prepaid legal services program on a subscription basis that is underwritten and provided by Pre-Paid Legal Services, Inc. The prepaid legal services program offers a network of attorneys in all states, and certain provinces and territories, to assist subscribers with legal matters such as drafting wills, living wills and powers of attorney, trial defense and motor vehicle-related matters. We receive commissions based on sales and renewals of these subscriptions.
15
We have a contractual arrangement with Answer Financial, Inc. (“Answer Financial”), an independent insurance agency, whereby U.S. sales representatives refer clients to Answer Financial to receive multiple, competitive auto and homeowners’ insurance quotes. Answer Financial’s comparative quote process allows clients to easily identify the underwriter that is most competitively priced for their type of risk. We receive commissions based on completed auto and homeowners’ placement of insurance and policy renewals and pay independent sales representatives a flat referral fee for each completed application and policy renewal.
We have a contractual arrangement with Vivint, Inc. (“Vivint”), a company that offers homeowners in the U.S. a comprehensive suite of products and services to protect and remotely control, monitor and manage their homes using any Internet-connected smart device. We receive commissions based on referrals that result in a subscription to Vivint’s home services and pay sales representatives a referral fee for each such subscription.
In the Canadian provinces of Alberta, Ontario and British Columbia (with respect to homeowners’ insurance only), we have an arrangement with SurexDirect.com Ltd. (“Surex Direct”), an independent insurance agency, whereby sales representatives refer clients to Surex Direct to receive multiple, competitive auto, commercial, and homeowners’ insurance quotes. Surex Direct’s comparative quote process allows clients to easily identify the underwriter that is most competitively priced for their type of risk. We receive referrals based on completed auto, commercial, and homeowners’ placement of insurance and policy renewals and pay sales representatives a flat referral fee for each completed application and policy renewal.
In Canada, we have a referral program for mortgage loan products offered by third-party lenders Rocket Mortgage Canada ULC and 8Twelve Mortgage Corp. Due to regulatory requirements, sales representatives in Canada only refer clients to the lender and are not involved in the loan application and closing process. We receive referral fees based on the funded loan amount and, in turn, pay a commission to independent sales representatives.
In Canada, we offer insurance products, including supplemental medical and dental, accidental death, and disability, to small businesses. These insurance products are underwritten and provided by The Edge Benefits Inc. and its affiliates. We receive a commission based on sales and renewals of these policies.
Regulation
Our business is subject to extensive laws and governmental regulations, including administrative determinations, court decisions and similar constraints. The purpose of the laws and regulations affecting our business is primarily to protect our clients and other consumers. Many of the laws and regulations to which we are subject are regularly re-examined, and existing or future laws and regulations may become more restrictive or otherwise adversely affect our operations.
Regulatory authorities periodically make inquiries regarding compliance by us and our subsidiaries with insurance, securities and other laws and regulations regarding the conduct of our insurance and securities businesses. At any given time, a number of financial or market conduct examinations of our subsidiaries may be ongoing. We cooperate with such inquiries and take corrective action when warranted.
Regulation of Our Insurance Business. Primerica Life, as a Tennessee-domiciled insurer, is regulated by the Tennessee Department of Commerce and Insurance and is licensed to transact business in the United States (except New York), the District of Columbia and most U.S. territories. NBLIC, as a New York-domiciled life insurance underwriting company and a wholly owned subsidiary of Primerica Life, is regulated by the New York State Department of Financial Services (“NYDFS”) and is licensed to transact business in all 50 U.S. states, the District of Columbia and the U.S. Virgin Islands.
State insurance laws and regulations regulate all aspects of our U.S. insurance business. Such regulation is vested in state agencies having broad administrative and, in some instances, discretionary power dealing with many aspects of our business, which may include, among other things, premium rates and increases thereto, reserve requirements, marketing practices, advertising, privacy, policy forms, algorithmic underwriting, grace periods, reinsurance reserve requirements, acquisitions, mergers, and capital adequacy.
Our U.S. insurance subsidiaries are required to file certain annual, quarterly and periodic reports with the supervisory agencies in the jurisdictions in which they do business, and their business and accounts are subject to examination by such agencies at any time. These examinations generally are conducted under National Association of Insurance Commissioners (“NAIC”) guidelines. Under the rules of these jurisdictions, insurance companies are examined periodically (generally every three to five years) by one or more of the supervisory agencies on behalf of the states in which they do business. Our most recent examinations of the financial condition and affairs of Primerica Life and NBLIC, as well as Peach Re, Inc. (“Peach Re”) and Vidalia Re, Inc. (“Vidalia Re”), special purpose financial captive insurance companies and wholly owned subsidiaries of Primerica Life, performed by the respective domiciliary state insurance departments as of December 31, 2019, were completed during 2021 with no material findings or recommendations noted.
Primerica Life Canada is federally incorporated and provincially licensed and is required to file periodic reports with Canadian regulatory agencies. It transacts business in all Canadian provinces and territories. Primerica Life Canada is regulated federally by the Office of the Superintendent of Financial Institutions Canada (“OSFI”) and provincially by the Superintendents of Insurance for each province and territory. Canadian federal and provincial insurance laws regulate all aspects of our Canadian insurance business. OSFI
16
regulates insurers’ corporate governance, financial and prudential oversight, and regulatory compliance, while provincial and territorial regulators oversee insurers’ market conduct practices and related compliance.
Primerica Life Canada files quarterly and annual financial statements prepared in accordance with International Financial Reporting Standards (“IFRS”) and other locally accepted standards with OSFI in compliance with legal and regulatory requirements. OSFI conducts periodic detailed examinations of insurers’ business and financial practices, including the control environment, internal and external auditing and capital adequacy, surpluses and related testing, legislative compliance and appointed actuary requirements. These examinations also address regulatory compliance with anti-money laundering practices, outsourcing, related-party transactions, privacy and corporate governance. Provincial regulators conduct periodic market conduct examinations of insurers doing business in their jurisdictions.
In addition to federal and provincial oversight, Primerica Life Canada is also subject to the guidelines set out by the Canadian Life and Health Insurance Association (“CLHIA”). CLHIA is an industry association that works closely with federal and provincial regulators to establish market conduct guidelines and sound business and financial practices addressing matters such as sales representative suitability and screening, insurance illustrations and partially guaranteed savings products.
The laws and regulations governing our U.S. and Canadian insurance businesses include numerous provisions governing the marketplace activities of insurers, including policy filings, payment of insurance commissions, disclosures, advertising, product replacement, sales and underwriting practices and complaints and claims handling. The state insurance regulatory authorities in the United States and the federal and provincial regulators in Canada generally enforce these provisions through periodic market conduct examinations.
In addition, most U.S. states and Canadian provinces and territories, as well as the Canadian federal government, have laws and regulations governing the financial condition of insurers, including standards of solvency, types and concentration of investments, establishment and maintenance of reserves, reinsurance and requirements of capital adequacy. As discussed previously, U.S. state insurance law and Canadian provincial insurance law also require certain licensing of insurers and their agents.
Insurance Holding Company Regulation; Limitations on Dividends. The states in which our U.S. insurance subsidiaries are domiciled have enacted legislation and adopted regulations regarding insurance holding company systems. These laws require registration of, and periodic reporting by, insurance companies domiciled within the jurisdiction that control, or are controlled by, other corporations or persons so as to constitute an insurance holding company system. These laws also affect the acquisition of control of insurance companies as well as transactions between insurance companies and companies controlling them.
The Parent Company is a holding company that has no significant operations. Our primary asset is the capital stock of our subsidiaries, and our primary liability is $600.0 million in principal amount of senior unsecured notes (the “Senior Notes”). As a result, we depend on dividends or other distributions from our insurance and other subsidiaries as the principal source of cash to meet our obligations, including the payment of interest on, and repayment of, principal of any debt obligations.
The states in which our U.S. insurance subsidiaries are domiciled impose certain restrictions on our insurance subsidiaries’ ability to pay dividends to us. In Canada, dividends can be paid subject to the paying insurance company’s continuing compliance with regulatory requirements and upon notice to OSFI. We determine the dividend capacity of our insurance subsidiaries using statutory accounting principles (“SAP”) promulgated by the NAIC and each subsidiary’s domiciliary state in the United States and using IFRS in Canada.
The following table sets forth the amount of cash and distributions paid or payable by our direct insurance subsidiaries:
|
|
Year ended December 31, |
|
|||||||||
|
|
2023 |
|
|
2022 |
|
|
2021 |
|
|||
|
|
(In thousands) |
|
|||||||||
Primerica Life |
|
$ |
330,000 |
|
|
$ |
255,000 |
|
|
$ |
30,000 |
|
Primerica Life Canada |
|
|
22,348 |
|
|
|
22,929 |
|
|
|
140,243 |
|
For additional information on dividend capacity and restrictions, see Note 16 (Statutory Accounting and Dividend Restrictions) to our consolidated financial statements included elsewhere in this report.
Policy and Contract Reserve Sufficiency Analysis. Under the laws and regulations of their jurisdictions of domicile, our U.S. insurance subsidiaries are required to conduct annual analyses of the sufficiency of their life insurance statutory reserves. In addition, other U.S. jurisdictions in which our U.S. subsidiaries are licensed may have certain reserve requirements that differ from those of their domiciliary jurisdictions. In each case, a qualified actuary must submit an opinion that states that the aggregate statutory reserves, when considered in light of the assets held with respect to such reserves, make good and sufficient provision for the associated contractual obligations and related expenses of the insurer. If such an opinion cannot be provided, then the affected insurer must set up additional reserves by moving funds from surplus. Our U.S. insurance subsidiaries most recently submitted these opinions without qualification to applicable insurance regulatory authorities.
17
Primerica Life Canada is also required to conduct regular analyses of the sufficiency of its life insurance statutory reserves. Life insurance reserving and reporting requirements are completed by Primerica Life Canada’s appointed actuary. Materials provided by the appointed actuary are filed with OSFI as part of our annual filing and are subject to OSFI’s review. Based upon this review, OSFI may institute remedial action against Primerica Life Canada as OSFI deems necessary. Primerica Life Canada has not been subject to any such remediation or enforcement by OSFI.
Surplus and Capital Requirements. U.S. insurance regulators have the discretionary authority, in connection with the ongoing licensing of our U.S. insurance subsidiaries, to limit or prohibit the ability of an insurer to issue new policies if, in the regulators’ judgment, the insurer is not maintaining a minimum amount of surplus or is in hazardous financial condition. Insurance regulators may also limit the ability of an insurer to issue new life insurance policies and annuity contracts above an amount based upon the face amount and premiums of policies of a similar type issued in the prior year. We do not believe that the current or anticipated levels of statutory surplus of our U.S. insurance subsidiaries present a material risk that any such regulator would limit the amount of new policies that our U.S. insurance subsidiaries may issue.
The NAIC has established risk-based capital (“RBC”) standards for U.S. life insurance companies, as well as a risk-based capital model act (the “RBC Model Act”) that has been adopted by the state insurance regulatory authorities. The RBC Model Act provides that life insurance companies must submit an annual RBC report to state regulators regarding their RBC based upon four categories of risk: asset risk; insurance risk; interest rate risk; and business risk. For each category, the capital requirement is determined by applying factors that vary based upon the degree of risk to various asset, premium and policy benefit reserve items. The formula is intended to be used by insurance regulators as an early warning tool to identify possible weakly capitalized companies for purposes of initiating further regulatory action. If an insurer’s RBC falls below specified levels, then the insurer would be subject to different degrees of regulatory action depending upon the level. These actions range from requiring the insurer to propose actions to correct the capital deficiency to placing the insurer under regulatory control.
In Canada, OSFI has authority to request an insurer to enter into a prudential agreement implementing measures to maintain or improve the insurer’s safety and soundness. OSFI also may issue orders to an insurer directing it to refrain from unsafe or unsound practices or to take action to remedy financial concerns. OSFI has neither requested that Primerica Life Canada enter into any prudential agreement nor issued any order against Primerica Life Canada.
In Canada, OSFI requires federally-regulated life insurance companies to maintain adequate capital in accordance with regulatory Capital Guidelines. The Capital Guidelines define and establish criteria and limits for determining an insurer’s required capital to support defined risks and the amount of qualifying regulatory available capital. In addition, OSFI requires companies to set internal target levels of capital sufficient to provide for all risks of the insurer, including risks specified in OSFI’s Capital Guidelines.
NAIC Pronouncements and Reviews. The NAIC promulgates model insurance laws and regulations for adoption by the states in order to standardize insurance industry accounting and reporting guidance. Although many state regulations emanate from NAIC model statutes and pronouncements, SAP continue to be established by individual state laws, regulations and permitted practices. Certain changes to NAIC model statutes and pronouncements, particularly as they affect accounting issues, may take effect automatically without affirmative action by a given state. With respect to some financial regulations and guidelines, non-domiciliary states sometimes defer to the interpretation of the insurance department of the state of domicile. However, neither the action of the domiciliary state nor the action of the NAIC is binding on a non-domiciliary state. Accordingly, a non-domiciliary state could choose to follow a different interpretation.
The NAIC has established guidelines to assess the financial strength of insurance companies for U.S. state regulatory purposes. The NAIC conducts annual reviews of the financial data of insurance companies primarily through the application of 12 financial ratios prepared on a statutory basis. The annual statements are submitted to state insurance departments to assist them in monitoring insurance companies in their states.
Statutory Accounting Principles. SAP is a basis of accounting developed by U.S. insurance regulators to monitor and regulate the solvency of insurance companies. In developing SAP, insurance regulators were primarily concerned with evaluating an insurer’s ability to pay all of its current and future obligations to policyholders. As a result, statutory accounting focuses on conservatively valuing the assets and liabilities of insurers, generally in accordance with standards specified by the insurer’s domiciliary jurisdiction. Uniform statutory accounting practices are established by the NAIC and generally adopted by regulators in the various U.S. jurisdictions. These accounting principles and related regulations determine, among other things, the amounts our insurance subsidiaries may ultimately pay to us as dividends, and they differ in many instances from U.S. generally accepted accounting principles (“U.S. GAAP”), which are designed to measure a business on a going-concern basis. Under U.S. GAAP, incremental direct costs of successful policy acquisitions are capitalized when incurred and then amortized over the life of the associated policies. The valuation of assets and liabilities under U.S. GAAP is based in part upon best estimate assumptions made by the insurer. U.S. GAAP-basis stockholders’ equity represents the ownership interest in the U.S. GAAP-measured net assets held by stockholders. As a result, the values for assets, liabilities and equity reflected in financial statements prepared in accordance with U.S. GAAP will be different from those reflected in financial statements prepared under SAP.
State Insurance Guaranty Funds Laws. Under most state insurance guaranty fund laws, insurance companies doing business therein can be assessed up to prescribed limits for policyholder losses incurred by insolvent companies. Most insurance guaranty fund laws
18
currently provide that an assessment may be excused or deferred if it would threaten an insurer’s own financial strength. In addition, assessments may be partially offset by credits against future state premium taxes.
Other Regulatory Changes. From time to time, various jurisdictions make changes to the state or provincial licensing examination process that may make it more difficult for independent sales representatives to obtain their life insurance licenses. In addition, certain jurisdictions have passed laws or proposed regulations that require insurers and insurance agents in the sale of life insurance, including term life insurance and annuities, to disclose conflicts of interest to consumers or meet standards of care requiring that their advice be in the customer’s best interest. The impact on our business and the level of resources necessary to conform to such new regulations will vary depending on the extent of changes required and the jurisdictions that adopt such regulations.
Regulation of Our Investment and Savings Products Business. PFS Investments is registered with, and regulated by, FINRA and the Securities and Exchange Commission (“SEC”) as a broker-dealer. PFS Investments operates as an introducing broker-dealer, which does not hold client accounts. As an investment adviser, PFS Investments is registered with and is regulated by the SEC. PFS Investments also is subject to regulation by the Department of Labor (“DOL”) with respect to certain retirement plans, and by state securities agencies. With respect to our managed investments offerings, PFS Investments provides clearing services through PBSI, a wholly owned broker-dealer. PBSI provides custody, trade execution, clearing, settlement and other services for customer assets invested through the Lifetime Investment Program. PBSI subcontracts its services through a fully disclosed clearing agreement with Pershing.
PFS Investments is registered in all 50 U.S. states and certain territories. All aspects of PFS Investments’ business are regulated, including sales methods and charges, trade practices, the use and safeguarding of customer securities, capital structure, recordkeeping, data protection, conduct and supervision of registered representatives.
PFS Investments is required to file quarterly reports as well as annual audited financial statements with the SEC pursuant to Section 17 of the Securities Exchange Act of 1934, as amended (the “Exchange Act”), and Rule 17a-5 thereunder. As part of filing these reports, PFS Investments is subject to minimum net capital requirements, as mandated by Rule 15c3‑1 of the Exchange Act.
In the United States, clients acquire securities products from PFS Investments in either a brokerage or advisory relationship. In a brokerage relationship, a PFS Investments registered representative making recommendations is subject to a “best interest” standard under SEC regulations and FINRA rules and, in some cases, state rules. PFS Investments markets mutual funds and variable annuities on a brokerage basis. In an advisory relationship, namely our managed investment offerings, PFS Investments and its investment advisory representative have a fiduciary obligation to the client and conduct ongoing monitoring of the client’s investments. PFS Investments’ sales representatives making recommendations with respect to retirement accounts also may have fiduciary obligations under DOL regulations.
PFS Investments is also approved as a non-bank custodian under IRS regulations and, in that capacity, may act as a custodian or trustee for certain retirement accounts. In addition, PFS Investments is an SEC-registered investment advisor and, under the name Primerica Advisors, offers managed investment programs. In most states, independent sales representatives are required to obtain an additional license to offer these programs.
PBSI is registered with, and regulated by, FINRA and the SEC, and is registered in all 50 U.S. states and certain territories. PBSI operates as the introducing broker-dealer for the accounts managed through the Lifetime Investment Program and does not hold customer accounts. PBSI introduces all accounts to Pershing, an unaffiliated clearing firm that provides order execution, custody, clearing, settlement and related services to PBSI’s customers. PBSI filed monthly reports beginning in April 2023 as a first year broker-dealer and is required to file annual audited financial statements with the SEC pursuant to Section 17 of the Exchange Act, and Rule 17a-5 thereunder. PBSI is subject to minimum net capital requirements as mandated by Rule 15c3‑1 of the Exchange Act.
PSS is registered with the SEC as a transfer agent and, accordingly, is subject to SEC rules and examinations. Acting in this capacity, PSS and third-party vendors employed by PSS are responsible for certain client investment account shareholder services.
PFSL Investments Canada is a mutual fund dealer registered with and regulated by the Canadian Investment Regulatory Organization (“CIRO”), the national self-regulatory organization that overseas all investment dealers, mutual fund dealers and trading activity on Canada's debt and equity marketplaces. PFSL Investments Canada is also registered with provincial and territorial securities commissions throughout Canada (collectively referred to as the Canadian Securities Administrators (“CSA”)). As a registered mutual fund dealer, PFSL Investments Canada performs the suitability review of mutual fund investment recommendations, and like our U.S. broker-dealers, it does not hold client accounts. PFSL Investments Canada is subject to the rules and regulations established by the CSA for the sale of securities, which include standards of conduct for the firm and its sales representatives.
PFSL Investments Canada is required to file monthly and annual financial statements and reports with CIRO that are prepared to comply with the prescribed CIRO reporting requirements. CIRO has established a risk adjusted capital standard for mutual fund dealers. Its formula is designed to provide advance warning of a member encountering difficulties. If a mutual fund dealer falls below specified levels, then restrictions would apply until rectified, including not being able to act on certain matters without prior written consent from CIRO.
19
PFSL Investments Canada sales representatives are required to be registered in the provinces and territories in which they do business, including regulation by the Autorité des marchés financiers in Quebec, and are also subject to regulation by CIRO. These regulators have broad administrative powers, including the power to limit or restrict the conduct of our business and impose censures or fines for failure to comply with the law or regulations.
PFSL Fund Management in Canada is registered as an Investment Fund Manager in connection with our Concert™ Series mutual funds and is regulated by provincial securities commissions.
PFSL Fund Management is required to file quarterly and annual financial statements with the Ontario Securities Commission (“OSC”) prepared to meet the requirements of National Instrument 31-103, Registration Requirements, Exemptions and Ongoing Registrant Obligations, based on the financial reporting framework specified in National Instrument 52-107, Acceptable Accounting Principles and Auditing Standards. PFSL Fund Management is required to maintain a minimum level of capital and file its quarterly and annual calculation of excess working capital with the OSC. As an Investment Fund Manager, PFSL Fund Management is required to file periodic reports with provincial and territorial securities commissions throughout Canada for its Concert™ Series mutual funds. Such reports include semi-annual and annual financial statements prepared in accordance with IFRS.
As the segregated funds are separate accounts of Primerica Life Canada, the segregated funds are also regulated by OSFI and included as part of the quarterly and annual financial statement filings for Primerica Life Canada. In addition, the segregated funds are also subject to the guidelines set out by the CLHIA.
Regulation of Our Senior Health Business. The sale of senior health insurance products is heavily regulated. e-TeleQuote is subject to numerous U.S. federal and state laws, regulations and agency guidance. These laws, regulations and guidance may involve financial services, privacy and data collection, data protection, intellectual property, competition, consumer protection and other subjects.
e-TeleQuote has a compliance function that is accountable to state insurance regulators, health insurance carriers and CMS at the federal level. The CMS Medicare Communication and Marketing Guidelines prescribe specific details of marketing to and interactions with Medicare beneficiaries and those soon to be Medicare eligible. e-TeleQuote digitally records all telephone calls with potential and current beneficiaries and stores them for requested retrieval by health insurance carriers or CMS as required.
We are subject to state and federal laws and regulations that require us to maintain the privacy and security of personal information which we collect from consumers.
The Health Insurance Portability and Accountability Act (“HIPAA”) limits the use and disclosure of certain individually identifiable health information and requires the implementation of administrative, physical and technological safeguards to protect such information. As a provider of services subject to HIPAA, we are permitted to use and disclose certain protected health information to provide our services to existing customers and for other limited purposes, but other uses and disclosures such as marketing communications require authorization from the applicant or must meet an exception specified in the HIPAA privacy regulations.
Regulation of Our Mortgage Brokerage Business. In the United States, state mortgage banking, brokering and lending laws regulate our mortgage brokerage business. In the United States, Primerica Mortgage is regulated at the state and local level by state banking commissioners and other equivalent regulators and at the federal level principally by the Consumer Financial Protection Bureau. Our mortgage brokerage business must comply with the laws, rules and regulations, as well as judicial and administrative decisions, in all of the jurisdictions in which we are licensed to offer mortgage loans, as well as an extensive body of federal laws and regulations. These state and federal laws and regulations address the type of loan products that can be offered to consumers through predatory lending and high cost loan laws and the type of licenses that must be obtained by individuals and entities seeking to solicit mortgage loan applications from consumers. As a mortgage broker licensee, Primerica Mortgage is subject to periodic examinations by regulators.
To offer mortgage loan products, Primerica Mortgage must hold an active mortgage company license in each state in which mortgage products are offered. Independent sales representatives engaged in the mortgage loan brokerage business must also be individually licensed as mortgage loan originators (and in some states also licensed as mortgage brokers) by each state in which they do business and be sponsored in the Nationwide Multistate Licensing System to conduct mortgage loan brokerage business exclusively on behalf of Primerica Mortgage.
In addition, our mortgage brokerage business is subject to various other federal laws, including the Truth In Lending Act and its implementing regulation, Regulation Z, the Equal Credit Opportunity Act and its implementing regulation, Regulation B, the Fair Housing Act and the Home Ownership Equity Protection Act. We are also subject to the Real Estate Settlement Procedures Act and its implementing regulation, Regulation X, which requires timely disclosures related to the nature and costs of real estate settlement amounts and limits those costs and compensation to amounts reasonably related to the services performed. We are also subject to the Dodd-Frank Wall Street Reform and Consumer Protection Act and any implementing regulations.
In Canada, our loan activities are more limited and the sales representatives only provide mortgage loan referrals to Rocket Mortgage Canada ULC and 8Twelve Mortgage Corp. The sales representatives are not required to obtain mortgage loan licensure from any regulatory entity to make these referrals.
20
Other Laws and Regulations. Our business is subject to a number of additional laws and regulations.
The USA Patriot Act of 2001 (the “Patriot Act”) contains anti-money laundering and financial transparency laws and mandates the implementation of various regulations applicable to broker-dealers and other financial services companies, including insurance companies. The Patriot Act seeks to promote cooperation among financial institutions, regulators and law enforcement entities in identifying parties that may be involved in terrorism or money laundering.
U.S. federal and state laws and regulations require financial institutions, including insurance companies, to protect the security and confidentiality of consumer financial information and to notify consumers about their policies and practices relating to their collection and disclosure of consumer information and their policies relating to protecting the security and confidentiality of that information. Similarly, federal and state laws and regulations also govern the disclosure and security of consumer health information. In particular, regulations promulgated by the U.S. Department of Health and Human Services regulate the disclosure and use of protected health information by health insurers and others (including certain life insurers), the physical and procedural safeguards employed to protect the security of that information and the electronic storage and transmission of such information. Congress and state legislatures are expected to consider additional legislation relating to privacy and other aspects of consumer information.
The Federal Trade Commission (“FTC”), through the Federal Trade Commission Act (the “FTC Act”), is responsible for protecting consumers and competition by preventing anticompetitive, deceptive, and unfair business practices. This includes regulation of deceptive trade practices such as pyramiding and unsubstantiated earnings or lifestyle claims in advertisements, including on social media.
The Gramm-Leach-Bliley Act (“GLBA”) regulates the use and disclosure of certain data that we collect from consumers, and it requires us to provide consumers with notice regarding how their nonpublic personal health and financial information is used and the opportunity to “opt out” of certain disclosures before sharing such information with third parties. GLBA generally requires safeguards for the protection of personal information.
The Telephone Consumer Protection Act of 1991 restricts telemarketing and the solicitation of customers without proper consent.
The Financial Consumer Agency of Canada (“FCAC”), a Canadian federal regulatory body, is responsible for ensuring that federally regulated financial institutions, which include Primerica Life Canada, comply with federal consumer protection laws and regulations, voluntary codes of conduct and their own public commitments. The Financial Transactions and Reports Analysis Centre of Canada is Canada’s financial intelligence unit. Its mandate includes ensuring that entities subject to the Proceeds of Crime (Money Laundering) and Terrorist Financing Act comply with reporting, recordkeeping and other obligations under that act. We are also subject to privacy laws under the jurisdiction of federal and provincial privacy commissioners and the consumer complaints provisions of federal insurance laws under the mandate of the FCAC, which requires insurers to belong to a complaints ombud-service and file a copy of their complaints handling policy with the FCAC.
Competition
We operate in a highly competitive environment with respect to the sale of financial products and the retention of the more productive members of the sales force. Competitors with respect to our term life insurance products consist both of stock and mutual insurance companies, as well as other financial intermediaries. Competitive factors affecting the sale of life insurance products include the level of premium rates, benefit features, risk selection practices, compensation of independent sales representatives and financial strength ratings from ratings agencies such as A.M. Best.
In offering our securities products, sales representatives compete with a range of other advisers, broker-dealers and direct channels, including wirehouses, regional broker-dealers, independent broker-dealers, insurers, banks, asset managers, registered investment advisers, mutual fund companies and other direct distributors. The mutual funds that we offer face competition from other mutual fund families and alternative investment products, such as exchange-traded funds, while our managed investment programs compete with other fee-based advisory services offered by financial services firms. Our annuity products compete with products from numerous other companies. Competitive factors affecting the sale of annuity products include price, product features, investment performance, commission structure, perceived financial strength, claims-paying ratings, service and distribution capabilities.
e-TeleQuote operates in a competitive marketplace. Medicare Advantage Plans compete with traditional Medicare as well as associated private health insurance options such as Medicare Supplement Plans. Beneficiaries may also consider private options that cater to unique needs not otherwise provided for by Medicare. e-TeleQuote faces competition from national direct to consumer brokers, health insurance carriers that directly market to beneficiaries and national brokers that either sell through independent agent sales forces or affiliate with independent downstream brokers. We have distributor agreements with many health insurance carriers that can compete with us by directly marketing to beneficiaries.
21
Privacy and Information Security
Our business prioritizes maintaining a secure, confidential environment for our clients, employees and other partners’ information. We have built sophisticated information technology platforms to support our clients and operations and the independent contractor sales force. Our data center houses an enterprise-class IBM mainframe as well as modern distributed and cloud technology infrastructure. Our business applications, many of which are proprietary, are supported by application developers and data center staff.
Primerica’s information security teams provide services, including project consulting, threat management, application and infrastructure assessments, secure configuration management, and information security administration. Additionally, we support advanced business continuity and disaster recovery capabilities.
For a discussion of the Company’s risk management, strategy, and governance related to cybersecurity, see “Item 1C. Cybersecurity”, which is incorporated herein by reference.
Human Capital Management
Employees
General. The following table provides information about our 3,450 employees as of December 31, 2023.
|
|
U.S. |
|
|
Canada |
|
|
Pakistan |
|
|||
Full-time employees |
|
|
2,432 |
|
|
|
274 |
|
|
|
143 |
|
Part-time employees |
|
|
21 |
|
|
|
1 |
|
|
|
- |
|
On-call and temporary employees(1) |
|
|
519 |
|
|
|
60 |
|
|
|
- |
|
Total |
|
|
2,972 |
|
|
|
335 |
|
|
|
143 |
|
The following table provides information about the diversity of our U.S. employees(1) at December 31, 2023:
|
|
Female |
|
|
Male |
|
|
Asian/Pacific Islander |
|
|
Black or African American |
|
|
Hispanic or Latino |
|
|
Other (6) |
|
|
White |
|
|||||||
Executive Management(2) |
|
|
49.5 |
% |
|
|
50.5 |
% |
|
|
5.7 |
% |
|
|
7.6 |
% |
|
|
2.9 |
% |
|
|
0.0 |
% |
|
|
83.8 |
% |
Non-Executive Management(3) |
|
|
61.6 |
% |
|
|
38.4 |
% |
|
|
5.8 |
% |
|
|
24.2 |
% |
|
|
8.2 |
% |
|
|
0.7 |
% |
|
|
61.1 |
% |
Professionals(4) |
|
|
55.1 |
% |
|
|
44.9 |
% |
|
|
16.4 |
% |
|
|
25.5 |
% |
|
|
7.1 |
% |
|
|
2.7 |
% |
|
|
48.3 |
% |
All Other Employees(5) |
|
|
68.3 |
% |
|
|
31.7 |
% |
|
|
3.8 |
% |
|
|
38.4 |
% |
|
|
16.0 |
% |
|
|
5.1 |
% |
|
|
36.7 |
% |
|
|
|
63.3 |
% |
|
|
36.7 |
% |
|
|
7.5 |
% |
|
|
32.0 |
% |
|
|
12.1 |
% |
|
|
3.7 |
% |
|
|
44.7 |
% |
The Corporate Governance Committee (the “Corporate Governance Committee”) of our Board of Directors (the "Board of Directors" or "Board") has responsibility for oversight of our diversity, equality, inclusion and belonging (“DEIB”) initiatives. Our Chief Administrative Officer is responsible for the development and implementation of our DEIB strategy. Identifying, developing, and mentoring diverse talent, while also ensuring our people-related policies and practices allow all employees to thrive at Primerica, is at the center of our DEIB efforts.
Primerica prides itself on having a collaborative culture with our employees. As such, none of our employees are members of any labor union, and we have never experienced any business interruption as a result of any labor disputes. For a more detailed description of our employee initiatives, see our 2023 Corporate Sustainability Report (available at https://investors.primerica.com), which is not incorporated by reference into this report or any filings with the SEC into which this report is incorporated by reference.
Talent Development. A core strength is that many of our employees, including our executives, have been with Primerica for over 20 years. The result of this longevity and loyalty is that many of our long-term executives and employees will reach retirement age over the coming years. Executive management continues to be focused on enhancing succession planning and talent pipeline identification and development both through the hiring of external talent and internal programs. The Corporate Governance Committee has
22
responsibility for oversight of our talent development. The Corporate Governance Committee meets regularly with our Chief Administrative Officer and endeavors to interact regularly with rising talent.
Compensation and Total Rewards. Primerica’s compensation philosophy is designed to attract, retain and motivate highly competent employees at all levels through compensation programs and practices. For 2023, approximately 350 of our employees participate in an annual incentive program that reflects both corporate performance and individual achievement. Incentive awards to officers are paid in both cash and equity (with a higher proportion being paid in equity for higher level officers) while Assistant Vice Presidents receive all of their incentive awards in cash. Employees below the level of Assistant Vice President are eligible for cash bonuses based on individual achievement. In 2023, we introduced a new cash bonus plan for managers and senior level professionals (approximately 325 employees) with higher bonus targets and broader eligibility than the existing cash bonus plan. Beginning in 2024, this new plan will be based on both corporate performance and individual achievement.
Among other things, our employee benefits package includes health and dental insurance, various paid-leave options, parental leave, a robust employee assistance program, and a 401(k) retirement savings plan with a generous company match.
Employee Engagement and Wellness. Employees are highly satisfied at Primerica, as evidenced by our employee retention rate in 2023 of 89% (excluding employees of e-TeleQuote). Further, from 2019 through 2023, we were recognized by Forbes as a Best Employer for Women, and we were named to the Bloomberg Gender Equality Index from 2020 through 2023. We were also recognized as a regional “Top Workplace” by the Atlanta Journal-Constitution for ten consecutive years from 2014 through 2023. From 2021 through 2023, we were nationally recognized as a “Top Workplace USA” by the employee engagement service partner that conducted the regional survey. In 2023, we were recognized as one of “America’s Greatest Workplaces” by Newsweek. In order to monitor employee satisfaction, we conduct annual employee surveys and provide detailed results to managers and our Board of Directors. Changes to policies, programs, and benefits packages are made based on this feedback. In addition, each year we hold a series of town hall meetings at our U.S. headquarters in Duluth, Georgia and our Canadian head office in Mississauga, Ontario during which employees hear updates on the Company’s performance and strategic direction, as well as information on benefits enhancements, policy changes, and other workplace topics. Employees have the opportunity to ask questions of senior management and are encouraged to raise issues of concern and offer suggestions for improvement.
Information Specific to Employees of e-TeleQuote. Since the acquisition of e-TeleQuote in July 2021, its employees have continued to operate under many of its existing human resources policies and procedures. Primerica’s Code of Conduct, however, applies to e-TeleQuote employees. e-TeleQuote’s compensation philosophy is designed to attract, retain and motivate high performing employees at all levels of the organization. e-TeleQuote’s incentive plans combine individual achievement and e-TeleQuote company performance in determining total incentive compensation.
e-TeleQuote’s licensed health insurance agents are full-time employees who are motivated through compensation systems that track performance and reward them accordingly. They receive an hourly wage plus an incentive compensation component based on individual sales performance and key performance indicators including retention of sales.
e-TeleQuote offers an employee benefits package which includes health and dental insurance, various paid-leave options including a parental leave program, an employee assistance program and a 401(k) retirement savings plan with a company match.
Independent Contractors. A description of the independent contractor sales force is included elsewhere in this section. See “— Our Distribution Model”, “— Recruitment of Sales Representatives”, “— Sales Force Motivation, Training, Communication and Sales Support Tools” “— Performance-Based Compensation Structure” and “— Supervision and Compliance.” The independent contractor sales force is extremely diverse, as it reflects the communities in which the sales representatives live and work. Further, the sales force utilizes strategic market groups to encourage professional and personal growth and development, including Women in Primerica, the African American Leadership Council and the Hispanic American Leadership Council, which we refer to as our Strategic Markets. These groups provide opportunities for networking and mentorship, sales and business management training and deep learning opportunities customized for these respective market segments. For a more detailed description of sales force initiatives, see our 2023 Corporate Sustainability Report on our investor relations website (https://investors.primerica.com), which is not incorporated by reference into this report or any filings with the SEC into which this report is incorporated by reference.
Board of Directors. Primerica’s Board of Directors values diversity among its members. As of December 31, 2023, 30% of our Board members were racially or ethnically diverse and 40% of our Board members were women. The Board has a Board Diversity Policy, requiring consideration of Board candidates based on merit against objective criteria tied to the needs of the Board and the Company at the time of nomination to the Board while giving due regard to diverse characteristics such as gender, race, ethnicity, country of origin, nationality or cultural background and other personal characteristics. Further, diverse Board candidates are to be considered whenever the Board commences a director search. The Board Diversity Policy is available on our investor relations website
23
(https://investors.primerica.com). In addition, our Board receives regular updates on the Company’s efforts to improve DEIB among its employees and independent contractors.
Available Information
We make available free of charge on our investor relations website (https://investors.primerica.com) our annual reports on Form 10-K, quarterly reports on Form 10-Q, current reports on Form 8-K, and amendments to those reports filed or furnished pursuant to Section 13(a) or 15(d) of the Exchange Act as soon as reasonably practicable upon filing such information with, or furnishing it to, the SEC. The Company’s reports are also available on the SEC’s website (www.sec.gov). The SEC maintains an Internet site that contains reports, proxy and information statements, and other information regarding issuers that file electronically with the SEC, at www.sec.gov. We routinely post financial and other information, including information about our corporate responsibility and sustainability efforts on the investor relations page of our corporate website (https://investors.primerica.com). Information included on any Company websites is not incorporated by reference into this report or any other filings with the SEC into which this report is incorporated by reference.
ITEM 1A. RISK FACTORS.
Risks Related to Our Distribution Structure
Our failure to continue to attract new recruits, retain independent sales representatives or license or maintain the licensing of independent sales representatives would materially adversely affect our business, financial condition and results of operations.
New independent sales representatives provide us with access to new clients, enable us to increase sales and provide the next generation of successful independent sales representatives. As is typical with distribution businesses, we experience a high rate of turnover among part-time independent sales representatives, which requires us to attract, retain and motivate a large number of independent sales representatives. Recruiting is performed by current independent sales representatives, and the effectiveness of recruiting is generally dependent upon our reputation as a provider of a rewarding and potentially lucrative income opportunity, as well as the general competitive and economic environment. Whether recruits are motivated to complete their training and licensing requirements and commit to selling our products depends in part on the effectiveness of our compensation and promotional programs, as well as the competitiveness of such programs compared with other companies, including other part-time business opportunities and the recruits’ desire to help middle-income families in their communities.
If our new business opportunity and the products we distribute do not generate sufficient interest to attract new recruits, motivate them to become licensed independent sales representatives and maintain their licenses, and incentivize them to sell our products and recruit other new independent sales representatives, our business would be materially adversely affected.
Certain Regional Vice Presidents (“RVPs”) have large sales organizations. These RVPs are responsible for attracting, motivating, supporting and assisting the independent sales representatives in their sales organizations. The loss of key RVPs together with substantial numbers of independent sales representatives from their related sales organizations for any reason could adversely affect our business and could impact our recruitment of new independent sales representatives.
Like many other companies with large independent sales organizations, we have written agreements with independent sales representatives that define the contractual terms of the relationships both during and after their affiliations with the Company. From time to time, current and former independent sales representatives violate these agreements, and the Company takes steps to enforce them. If former or current independent sales representatives are successful in legally challenging our written agreements, then our business could be adversely impacted.
Furthermore, if we or any other businesses with a similar distribution structure engage in practices resulting in increased negative public attention for our business model, the resulting reputational challenges could adversely affect our ability to attract new recruits. Companies such as ours that distribute through independent agents to sell directly to customers have been and may continue to be the subject of negative commentary on website postings, social media and other media. This negative commentary can spread inaccurate or incomplete information about distribution companies in general or the Company in particular, which can make our recruiting more difficult.
From time to time, various jurisdictions make changes to the state or provincial licensing examination process that may make it more difficult for independent sales representatives to obtain or retain their life insurance and/or securities licenses. For example, the Financial Industry Regulatory Authority (“FINRA”) has changed the continuing education (“CE”) regulatory requirement from a three-year period to an annual requirement for securities-licensed representatives. In addition, the North American Securities Administrators Association approved a model rule for participating states that imposes a CE requirement for investment adviser
24
representatives. Such changes place an increased burden on representatives to maintain their securities licenses, which could negatively impact the size of the active securities sales force in the event that representatives do not complete the applicable CE requirements on a timely basis.
There are a number of laws and regulations that could apply to our independent contractor distribution model, which could require us to modify our distribution structure.
We have not been, and are not currently, subject to business opportunity laws because the amounts paid by the new independent sales representatives to us: (i) are less than the minimum thresholds set by many state and provincial statutes and (ii) are not fees paid for the right to participate in a business, but rather are for bona fide expenses such as state and provincial-required insurance examinations and pre-licensing training. We have not been, and are not currently, subject to franchise laws for similar reasons. However, there is a risk that a governmental agency or court could disagree with our assessment or that these laws and regulations could change. In addition, although we do not believe that the Federal Trade Commission’s (“FTC”) current Business Opportunity Rule applies to the Company, it is under review by the FTC. As a result of that review or otherwise, it could be amended or interpreted in a manner inconsistent with our current interpretation. Becoming subject to business opportunity or franchise laws or regulations could require us to provide additional disclosures and regulate the manner in which we recruit independent sales representatives that may increase the expense of, or adversely impact our recruitment of, new independent sales representatives.
There are various laws and regulations, including laws of general application such as the Federal Trade Commission Act (“FTC Act”), which prohibit fraudulent or deceptive practices, including but not limited to, pyramid schemes and misrepresentations regarding distributors’ earnings potential. The FTC has issued an Advance Notice of Proposed Rulemaking regarding earnings claims, which is the first step in a multi-year rulemaking process. Likewise, the FTC has exercised its Penalty Offense Authority found in Section 5(m)1(B) of the FTC Act by issuing Notices of Penalty Offenses as a reminder of the law on earnings claims and as a deterrence against violations. The application of these laws and regulations to a given set of business practices is inherently fact-based and, therefore, is subject to interpretation by applicable enforcement authorities. Although we believe that our business practices comply with applicable laws and regulations, there is a risk that a governmental agency or court could disagree with our assessment, or that these laws and regulations could change in actuality or in application, which could require us to restructure our operations or result in regulatory fines, penalties or other costs, or reputational harm, or could otherwise adversely affect our business, financial condition and results of operations.
Various unfair and deceptive trade practices laws and regulations could potentially be invoked to challenge aspects of our recruiting of independent sales representatives. In particular, we and the independent sales representatives use promotional materials in recruiting that describe the potential business opportunity of becoming an independent sales representative and information with respect to earnings and lifestyle statements. These materials and statements made by us or the independent sales representatives may be deemed to be unfair, deceptive, or misleading under the FTC Act or other federal, state and provincial laws or regulations and could result in regulatory fines, penalties or other costs, or reputational harm. Being out of compliance with the aforementioned laws and regulations could require changes to the recruiting of independent sales representatives, which could have a materially adverse effect on our business, financial condition and results of operations.
There may be adverse tax, legal or financial consequences if the classification of our independent contractor sales representatives is changed.
Other than e-TeleQuote Insurance, Inc.’s (“e-TeleQuote”) team of licensed health insurance agents, sales representatives are independent contractors who operate their own businesses. Although we believe that we have properly classified these sales representatives as independent contractors, there is a risk that the Internal Revenue Service (“IRS”), the Department of Labor (“DOL”), the Canada Revenue Agency, a court or other authority will take a different view. Furthermore, the tests governing the determination of whether an individual is considered to be an independent contractor or an employee are fact-sensitive and vary from jurisdiction to jurisdiction. Laws and regulations that govern the status and classification of independent sales representatives are subject to change or interpretation.
The classification of workers as independent contractors continues to be the subject of increasing federal, state and provincial legislative, regulatory and judicial interest. Legislative and regulatory proposals have been introduced by federal and state authorities, and judicial decisions have been made, that call for or result in greater scrutiny of independent contractor classifications. In January 2024, the DOL, issued a final rule interpreting the “economic realities” worker classification standard applicable to the Fair Labor Standards Act. The DOL’s interpretation generally aligns with legal precedent, relying on an analysis of six typical factors indicating worker status and taking into account the “totality of the circumstances”. Other federal and state legislative and regulatory proposals regarding worker classification have also come under consideration. It is difficult to predict what the outcome of worker classification activity may be. Changes to worker classifications could have a material adverse impact on our business, financial condition and results of operations because sales representatives (other than those employed by e-TeleQuote) are independent contractors.
25
If there is an adverse determination with respect to the classification of some or all of the independent contractors by a court or governmental agency, we could incur significant costs complying with such laws and regulations, including tax withholding, social security payments, retirement plan contributions and recordkeeping, employee benefits, payment of wages or modification of our business model, any of which could have a material adverse effect on our business, financial condition and results of operations. In addition, there is the risk that we may be subject to significant monetary liabilities arising from fines or judgments as a result of any such actual or alleged non-compliance with federal, state, or provincial laws.
The Company’s, the independent sales representatives’, or the licensed health insurance agents’ violation of, or non-compliance with, laws and regulations and related claims and proceedings could expose us to material liabilities.
Extensive federal, state, provincial and territorial laws regulate our product offerings, imposing certain requirements that independent sales representatives and licensed health insurance agents must follow in dealing with clients. Instances of non-compliance or violations on the part of the independent sales representatives or licensed health insurance agents could have a material adverse effect on our business, financial condition and results of operations.
In addition to imposing requirements on independent sales representatives and licensed health insurance agents when dealing with clients, federal, state, provincial and territorial laws and regulations generally require us to maintain a system of supervision reasonably designed to ensure that independent sales representatives and licensed health insurance agents comply with the requirements to which they are subject. We have policies and procedures to comply with these laws and regulations. Further, at any given time, we may have pending state, federal or provincial examinations or inquiries of our investment and savings products, insurance, mortgage, and other businesses. However, despite these compliance and supervisory efforts, the breadth of our operations and the broad regulatory requirements could result in oversight failures and instances of non-compliance or violations on the part of the Company, independent sales representatives or licensed health insurance agents.
From time to time, we are subject to private litigation as a result of alleged misconduct by independent sales representatives and/or licensed health insurance agents. Non-compliance with or violations of laws or regulations could result in adverse findings in either examinations or litigation and could subject us to sanctions, monetary liabilities, restrictions on or the loss of the operation of our business, or reputational harm, any of which could have a material adverse effect on our business, financial condition and results of operations.
Risks Related to Our Insurance Business and Reinsurance
Our life insurance business may face significant losses or volatility if our actual experience differs from our expectations regarding mortality, persistency, disability or reinsurance.
We set prices for life insurance policies based upon expected claim payment patterns derived from assumptions we make about the mortality rates, or likelihood of death, of our policyholders in any given year. The long-term profitability of these products depends upon how our actual mortality rates compare to our pricing assumptions. For example, if mortality rates are higher than those assumed in our pricing assumptions, we could be required to make more death benefit payments under our life insurance policies or to make such payments sooner than we had projected, which may decrease the profitability of our term life insurance products.
The prices and expected future profitability of our life insurance products are also based, in part, upon assumptions related to persistency. Actual persistency that is lower than our persistency assumptions could have an adverse effect on profitability, especially in the early years of a policy, primarily because we may not collect sufficient revenue to cover our acquisition costs. Actual persistency that is higher than our persistency assumptions could have an adverse effect on profitability in the later years of a block of policies because the anticipated claims experience is higher in these later years. We are precluded from adjusting premiums on our in-force business during the initial term of the policies, and our ability to adjust premiums on in-force business after the initial policy term is limited to the maximum premium rates in the policy.
Our profitability is also affected by the extent actual disability rates underlying our waiver benefits, including recovery rates for individuals currently disabled, differ from actuarial assumptions. The waiver benefit is secondary to the death benefit coverage provided. However, the waiver benefit is not reinsured and material changes in assumptions compared to expectations can have a disproportionate impact on our financial results.
We reinsure 80-90% of our mortality risk. Interest in reinsuring our mortality risk could diminish if there is increased volatility in the reinsurance market and/or a change in the perceived value of reinsuring Primerica’s business. As a result, in the future we may not be able to access reinsurance on new business and we could be forced to reinsure a smaller percentage of our mortality risk or the same percentage but at higher costs much greater than we have historically paid.
26
Our life insurance business is highly regulated, and statutory and regulatory changes may materially adversely affect our business, financial condition and results of operations.
Life insurance statutes and regulations are generally designed to protect the interests of the public and policyholders. Those interests may conflict with the interests of our stockholders. Currently, in the United States, the power to regulate insurance resides almost exclusively with the states, which grant state insurance regulators broad powers to regulate almost all aspects of our insurance business. Much of this state regulation follows model statutes or regulations developed or amended by the National Association of Insurance Commissioners (“NAIC”), which is composed of the insurance commissioners of each U.S. jurisdiction. The NAIC re-examines and amends existing model laws and regulations (including holding company regulations), in addition to determining whether new ones are needed.
The Federal Insurance Office is authorized to, among other things, study methods to modernize and improve insurance regulation. We cannot predict with certainty whether, or in what form, reforms will be enacted and, if so, whether the enacted reforms will materially affect our business. Changes in federal statutes, financial services regulation and federal taxation, in addition to changes to state statutes and regulations, may be more restrictive than current requirements or may result in higher costs, and could materially adversely affect our business, financial condition and results of operations.
In 2018, the New York Department of Financial Services (“NYDFS”) amended its suitability regulation for annuities (the “NY Amended Suitability Rule”), requiring insurers and insurance producers to ensure that life insurance sales and annuities are suitable and consistent with the customer’s “best interest”. In early 2020, the NAIC approved revisions to the Suitability in Annuity Transactions Model Regulation (“NAIC Annuities Best Interest Rule”) requiring insurance producers to act in the “best interest” of consumers when recommending an annuity. Most states have adopted, and others are proposing to adopt, the NAIC Annuities Best Interest Rule. The NY Amended Suitability Rule and the NAIC Annuities Best Interest Rule impose a higher standard of care than previously required, enhanced disclosure, and other obligations with respect to life and/or annuities recommendations, which may increase our regulatory or litigation risk.
Federal and provincial insurance laws regulate all aspects of our Canadian insurance business. Changes to federal or provincial statutes and regulations may be more restrictive than current requirements or may result in higher costs, which could materially adversely affect our business, financial condition and results of operations. If the Office of the Superintendent of Financial Institutions (“OSFI”) determines that our corporate actions do not comply with applicable Canadian law, Primerica Life Canada could face sanctions or fines, and be subject to increased capital requirements or other requirements.
The Minister of Finance (Canada) approved our indirect acquisition of Primerica Life Canada in 2010 with the expectation that we will provide ongoing financial, managerial or operational support to this subsidiary as necessary. If OSFI determines Primerica Life Canada is not receiving adequate support from the Parent Company under applicable Canadian law, Primerica Life Canada may be subject to increased capital requirements or other requirements deemed appropriate by OSFI.
If there are extraordinary changes to U.S. or Canadian statutory or regulatory requirements, we may be unable to fully comply with or maintain all required insurance licenses and approvals. As a result, the regulatory authorities could preclude or temporarily suspend us from conducting some or all of our insurance activities or impose fines or penalties on us, which could materially adversely affect our business, financial condition and results of operations. We cannot predict with certainty the effect any proposed or future legislation or regulatory initiatives may have on the conduct of our business.
A decline in the regulatory capital ratios of our insurance subsidiaries could result in increased scrutiny by insurance regulators and ratings agencies and have a material adverse effect on our business, financial condition and results of operations.
Each of our U.S. insurance subsidiaries is subject to Risk-Based Capital (“RBC”) standards (imposed under the laws of its respective jurisdiction of domicile). The RBC formula for U.S. life insurance companies generally establishes capital requirements relating to asset, insurance, interest rate and business risks. Our U.S. insurance subsidiaries are required to report RBC calculations annually to the applicable state department of insurance and the NAIC. Our Canadian life insurance subsidiary is subject to the Life Insurance Capital Adequacy Test Guideline (“LICAT”) and is required to provide its capital ratio calculations to the Canadian regulators. The capitalization of our insurance subsidiaries is maintained at levels in excess of the effective minimum requirements of the NAIC in the United States and OSFI in Canada. In any particular year, statutory capital and surplus amounts and RBC and LICAT ratios may increase or decrease depending on a variety of factors, many of which are outside of our control.
Our financial strength and credit ratings are significantly influenced by the statutory surplus amounts and RBC and LICAT ratios of our insurance company subsidiaries. Ratings agencies may change their internal models, effectively increasing or decreasing the amount of statutory capital our insurance subsidiaries must hold to maintain their current ratings. Ratings agencies also may downgrade the ratings of securities held in our insurance subsidiaries’ portfolios, which could result in a reduction of our insurance subsidiaries’ statutory capital and surplus and RBC. Our insurance subsidiaries may need additional capital and, if needed, we may not
27
be able to provide it to maintain the targeted RBC and LICAT levels to support their business operations, either of which may impact our financial strength and credit ratings.
The failure of any of our insurance subsidiaries to meet its applicable RBC and LICAT requirements or minimum capital and surplus requirements could subject it to further examination or corrective action imposed by insurance regulators, including limitations on its ability to write additional business, supervision by regulators or seizure or liquidation. Any corrective action imposed could have a material adverse effect on our business, financial condition and results of operations. A decline in RBC or LICAT also limits the ability of our insurance subsidiaries to pay dividends or make distributions and could be a factor in causing ratings agencies to downgrade the financial strength ratings of our insurance subsidiaries. Such downgrades would have an adverse effect on our ability to write new insurance policies and, therefore, could have a material adverse effect on our business, financial condition and results of operations.
A significant ratings downgrade by a ratings organization could materially adversely affect our business, financial condition and results of operations.
Each of our non-captive life insurance subsidiaries has been assigned a financial strength rating by A.M. Best. Primerica Life currently also has an insurer financial strength rating from each of Standard & Poor’s (“S&P”) and Moody’s.
The financial strength ratings of our rated insurance subsidiaries are subject to periodic review using, among other things, the ratings agencies' proprietary capital adequacy models and are subject to revision or withdrawal at any time. Insurance financial strength ratings are directed toward the concerns of policyholders and are not intended for the protection of stockholders or as a recommendation to buy, hold or sell securities. Our financial strength ratings will affect our competitive position relative to other insurance companies. If the financial strength ratings of our insurance subsidiaries fall below certain levels, some of our policyholders may move their business to our competitors. In addition, the models used by ratings agencies to determine financial strength are different from the capital requirements set by insurance regulators.
Ratings organizations review the financial performance and financial conditions of insurance companies and provide opinions regarding financial strength, operating performance and ability to meet obligations to policyholders. A significant downgrade in the financial strength ratings of any of our insurance subsidiaries, or the announced potential for a downgrade, could have a material adverse effect on our business, financial condition and results of operations.
If the rating agencies or regulators change their approach to financial strength ratings and statutory capital requirements, we may need to take action to maintain current ratings and capital adequacy ratios, which could have a material adverse effect on our business, financial condition and results of operations.
The Parent Company currently has investment grade credit ratings from S&P, Moody’s, and A.M. Best. These ratings are indicators of a debt issuer's ability to meet the terms of debt obligations and are important factors in its ability to access liquidity in the debt markets. A rating downgrade by a rating agency can occur at any time if the rating agency perceives an adverse change in our financial condition, results of operations or ability to service debt. If such a downgrade occurs, it could have a material adverse effect on our financial condition and results of operations in many ways, including adversely limiting our access to capital in the unsecured debt market and potentially increasing the cost of such debt.
The failure by any of our reinsurers or reserve financing counterparties to perform its obligations to us could have a material adverse effect on our business, financial condition and results of operations.
We rely on a limited number of reinsurers in the United States and Canada to diversify our risk and to manage our loss exposure to mortality risk. Reinsurance does not relieve us of our direct liability to our policyholders, even when the reinsurer is liable to us. We, as the insurer, are required to pay the full amount of death benefits even in circumstances where we are entitled to receive payments from the reinsurer. Our reinsurers may be unable to pay the amounts they owe us on a timely basis or at all. Further, reinsurers might refuse or fail to pay losses that we cede to them or might delay payment. Since death benefit claims may be paid long after a policy is issued, we bear credit risk with respect to our reinsurers. The creditworthiness of our reinsurers may change before we can recover amounts to which we are entitled. Any such failure to pay by our reinsurers could have a material adverse effect on our business, financial condition and results of operations. One of our reinsurers that is associated with a small block of runoff business was in receivership and has filed for liquidation. We have written down all associated reinsurance recoverable balances to zero in our statement of financial position.
We also have in place coinsurance agreements that we originally entered into at the time of our initial public offering (the “IPO”) in 2010, pursuant to which we ceded between 80% and 90% of the risks and rewards of our term life insurance policies that were in force at year-end 2009. Under this arrangement, our existing reinsurance agreements remain in place. Each coinsurer entered into trust agreements with our respective insurance subsidiaries and a trustee pursuant to which the coinsurer placed assets (primarily treasury and fixed-income securities) in trust for such subsidiary’s benefit to secure the coinsurer’s obligations to such subsidiary. Each such coinsurance agreement requires the relevant coinsurer to maintain assets in trust, the amount of which will not be less than the amount
28
of the statutory reserves for the coinsured liabilities. In Canada, the IPO coinsurer must hold pledged assets in an amount sufficient for us to take credit for reinsurance in a Canadian financial institution, not affiliated with the IPO coinsurer. Our Canadian insurance company has an enforceable security interest that has priority over any other security interest for the pledged assets. Furthermore, our insurance subsidiaries have the right to recapture the business upon the occurrence of an event of default under their respective coinsurance agreement subject to any applicable cure periods. While any such recapture would be at no cost to us, such recapture would result in a substantial increase in our insurance exposure and require us to be fully responsible for the management of the assets set aside to support statutory reserves. The type of assets we might obtain as a result of a recapture may not be as liquid as our current invested asset portfolio and could result in an unfavorable impact on our risk profile.
There is no assurance that the relevant coinsurer will pay the coinsurance obligations owed to us now or in the future or that it will pay these obligations on a timely basis. If any of the coinsurers becomes insolvent and the trust account to support the obligations of such coinsurer is insufficient to pay such coinsurer’s obligations to us and we fail to enforce our right to recapture the business, it could have a material adverse effect on our business, financial condition and results of operations.
We have entered into transactions by which we finance redundant statutory reserves of certain issue years of our term life insurance business. Under these transactions, we pay a fee to financial counterparties for their commitment to support redundant reserves and provide corresponding statutory reinsurance credit, allowing us to more efficiently manage our capital. If the financial strength of these counterparties was significantly impaired to the extent that their support of our redundant reserves could no longer be relied upon, it could have a material adverse effect on our business, financial condition, and results of operations.
Risks Related to Our Investment and Savings Products Business
Our Investment and Savings Products segment is heavily dependent on a limited platform of mutual fund and annuity products offered by a relatively small number of companies and managers. If these products fail to remain competitive with other investment options, our business, financial condition and results of operations could be materially adversely affected.
We offer mutual funds and annuities through our U.S. retail broker-dealer, but not exchange traded funds, individual stocks and bonds, or alternative investments. Our advisory program in the U.S. offers a wider menu of investment types; however, fewer of the independent sales representatives are eligible to offer the program. Our current investment products in Canada consist of two families of mutual funds that include a diversified offering of equity, fixed-income and money market funds. Because of these limitations, our business could be materially adversely impacted if consumer demand were to shift toward products we do not offer. In addition, if any of our investment and savings products fail to achieve satisfactory investment performance, our clients may seek higher yielding or lower cost investment options, and we could experience higher redemption rates.
If our relationship with one or more of our funds, annuities or managers is significantly altered or terminated or there is a shift in the business mix, our business, financial condition and results of operations could be materially adversely affected.
We receive revenue and other marketing and support fees from the manufacturers of the investment and savings products we distribute and the investment managers we make available. We earn a significant portion of our earnings through our relationships with a small group of mutual fund and annuity companies. A decision by one or more of these companies to alter or discontinue their current arrangements or product offerings with us, or a change in law or regulation that compels us to alter or discontinue such arrangements, could materially adversely affect our business, financial condition and results of operations.
In addition, we derive a growing portion of our earnings through our asset-based advisory platform. A shift in the business mix of new investments across our products and platforms could materially impact cash flows to our business, financial condition and results of operations.
In addition to sales commissions and asset-based compensation, a portion of our earnings from investment and savings products comes from recordkeeping services that we provide to mutual fund companies and from fees earned for custodial services that we provide to clients with retirement plan accounts in the funds of these mutual fund companies.
A decision by one or more of our fund companies, annuities companies, or managers to alter or discontinue their current arrangements with us, or a change in law or regulation that compels us to alter or discontinue such arrangements, would materially adversely affect our business, financial condition and results of operations.
The Company’s or the securities-licensed independent sales representatives’ violations of, or non-compliance with, laws and regulations of the securities business could expose us to material liabilities.
Our subsidiary broker-dealers, Primerica Brokerage Services, Inc. (“PBSI”) and PFS Investments, Inc. (“PFS Investments”), and the independent sales representatives, are subject to federal and state regulation of the securities business. PFS Investments is additionally
29
a registered investment adviser and its investment adviser representatives likewise are held to a high standard of conduct. Our subsidiary, Primerica Shareholder Services, Inc. (“PSS”), is a registered transfer agent engaged in the recordkeeping business and is subject to regulation by the Securities and Exchange Commission (“SEC”). Violations of, or non-compliance with, laws or regulations applicable to the activities of PFS Investments or PSS, or violations by a third party with which PFS Investments or PSS contracts, could subject us to regulatory actions and/or litigation. Such events could result in the imposition of cease and desist orders, fines or censures, restitution to clients, suspension or revocation of SEC registration, suspension or expulsion from FINRA, reputational damage and legal expense, any of which could materially adversely affect our business, financial condition and results of operations.
Our Canadian broker-dealer subsidiary, PFSL Investments Canada and the sales representatives are subject to the securities laws of the provinces and territories of Canada in which we sell our mutual fund products and to the rules of the Canadian Investment Regulatory Organization (“CIRO”) (formerly known as the Mutual Fund Dealers Association of Canada), the self-regulatory organization governing mutual fund dealers (except in the case of Quebec, the Autorité des Marchés Financiers (“AMF”)). PFSL Investments Canada is subject to periodic review by both the CIRO and the provincial and territorial securities commissions to assess its compliance with, among other things, applicable capital requirements and sales practices and procedures. These regulators have broad administrative powers and may impose sanctions that could materially adversely affect our business, financial condition and results of operations.
If heightened standards of conduct or more stringent licensing requirements (such as those adopted by the SEC) and the DOL, state legislatures or regulators or Canadian securities and insurance regulators, are imposed on us or the independent sales representatives, or selling compensation is reduced as a result of new legislation or regulations, it could have a material adverse effect on our business, financial condition and results of operations.
The U.S. independent sales representatives are subject to federal and state regulation as well as state licensing requirements. PFS Investments, which is regulated as a broker-dealer and registered investment adviser, and U.S. sales representatives are currently subject to general anti-fraud limitations under the Securities Exchange Act of 1934, as amended, the Investment Advisers Act of 1940 (the “Investment Advisers Act”) and SEC rules and regulations, as well as other conduct standards prescribed by the FINRA. These standards generally require that broker-dealers, investment advisers, and their sales representatives disclose and mitigate conflicts of interest that might affect the advice or recommendations they provide and require them to make investment recommendations in the best interest of customers. In 2019, the SEC adopted rules addressing the standards of conduct applicable to broker-dealers and their associated persons (collectively, “Reg BI”). Among other things, Reg BI created a “best interest” standard of conduct similar to the fiduciary standard applicable to investment advisers. In 2020, the DOL issued PTE 2020-02, an exemption for the retention of compensation by a fiduciary. In October 2023, the DOL proposed a new definition to determine fiduciary status and proposed amendments to PTE 2020-02, among other proposals. Reg BI and the DOL regulations impose higher standards of care and enhanced obligations that increase regulatory and litigation risk to our business.
In addition to federal regulators, certain states have proposed or passed laws or proposed or issued regulations requiring investment advisers, broker-dealers, and/or insurance agents to meet fiduciary standards or standards of care that their advice be in the customer’s best interest, and to mitigate and disclose conflicts of interest to consumers of investment and insurance products. The severity of the impact that such state laws or regulations could have on our business vary from state to state depending on the content of the legislation or regulation and how it would be applied by state regulators and interpreted by the courts. Therefore, such laws or regulations could disrupt our brokerage business in the relevant state. We cannot quantify the financial impact, if any, of any changes to our business that may be necessary in order to comply with such laws or regulations at this time.
The organization of provincial and territorial securities regulators (collectively referred to as the Canadian Securities Administrators (“CSA”)) implemented rule amendments that prohibit up-front sales commissions by fund companies for the sale of mutual funds offered under a prospectus in Canada (the “DSC Ban”), effective June 1, 2022. During 2022, in response to the DSC Ban, we began to offer through our independent sales representatives, a unique and exclusive range of funds under Principal Distributor agreements (the “PD Funds”) with two third-party mutual fund companies (the “Principal Distributor model”).
While we received regulatory approval for the Principal Distributor model, the CSA has indicated that it intends to closely re-examine the Principal Distributor provisions of National Instrument 81-105, including potentially through a public consultation on sales practices. Further, the CSA may require undertakings or consider future amendments that would require modifications to the Principal Distributor model, including with respect to advance and chargeback commissions. Such undertakings or amendments could require us to restructure our Principal Distributor model for the sale of mutual funds, or discontinue use, which could have a material adverse effect on our investment advisory business in Canada.
The Canadian Council of Insurance Regulators mandated a cessation of deferred sales charges on segregated fund contracts entered into after May 31, 2023. Deferred sales charges will continue to be allowed on subsequent deposits of existing segregated funds contracts for a period of time; however, insurance regulators will be further evaluating whether to allow its continued use. As we anticipated, we experienced a decline in segregated funds product sales beginning in June 2023. Without further clarity from
30
regulators on allowable segregated funds compensation practices, we are unable to evaluate and introduce new compensation practices for the sale of our segregated funds or similar products we could potentially distribute on behalf of third parties. This could have a further material adverse effect on our investment and savings products business in Canada.
Heightened standards of conduct or restrictions on compensation as a result of any of the above items or other similar proposed rules or regulations could also increase the compliance and regulatory burdens on the sales representatives and could lead to increased litigation and regulatory risks, changes to our business model, a decrease in the number of licensed sales representatives and a reduction in the products we offer to our clients, any of which could have a material adverse effect on our business, financial condition and results of operations.
If our suitability policies and procedures, or our policies and procedures for compliance with federal, state or provincial regulations governing standards of care, were deemed inadequate, it could have a material adverse effect on our business, financial condition and results of operations.
We review the account applications that we receive for our investment and savings products for suitability, for compliance with Reg BI, the Investment Advisers Act and the DOL regulations, and for compliance with other federal, state or provincial regulations governing standards of care, as applicable. We believe that the policies and procedures we implement to help sales representatives assist clients in making investment choices are reasonably designed to achieve compliance with applicable securities laws and regulations and to satisfy other applicable federal, state, and provincial standards of care. Nonetheless, it is possible that the SEC, FINRA, the DOL, the IRS, state securities and insurance regulators, CIRO or AMF may not agree. Further, we could be subject to regulatory actions or private litigation, which could materially adversely affect our business, financial condition and results of operations.
The support tools we make available to the sales force are designed to educate potential and existing clients, help identify their financial needs, generally introduce the potential benefits of our product offerings, and identify suitable investment products. The tools themselves or the assumptions and methods of analyses embedded in them could be challenged and subject us to regulatory action by the SEC, the DOL, FINRA or other regulators, or private litigation, which could materially adversely affect our business, financial condition and results of operations.
Non-compliance with applicable regulations could lead to revocation of our subsidiary’s status as a non-bank custodian, which could have a material adverse effect on our business.
PFS Investments is a non-bank custodian of retirement accounts, as permitted under Treasury Regulation 1.408-2. A non-bank custodian is an entity that is not a bank and that is permitted by the IRS to act as a custodian for retirement plan account assets of our clients. The IRS retains authority to revoke or suspend that status if it finds that PFS Investments is unwilling or unable to administer retirement accounts in a manner consistent with the requirements of the applicable regulations. Revocation of PFS Investments’ non-bank custodian status would affect its ability to earn revenue for providing such services and, consequently, could materially adversely affect our business, financial condition and results of operations.
Risks Related to e-TeleQuote’s Senior Health Insurance Distribution Business
We may not be able to execute an effective senior health insurance business strategy, which could adversely affect our business, financial condition and results of operations.
On July 1, 2021, we acquired 80% of e-TeleQuote and subsidiaries, a senior health insurance distributor of Medicare related insurance policies and, on July 1, 2022, we acquired the remaining 20%, which comprise our Senior Health business segment. If e-TeleQuote does not perform as expected, it could materially adversely affect our business, financial condition and results of operations.
We test goodwill for impairment at least annually. As of December 31, 2023, we have recognized cumulative goodwill impairment charges in our Senior Health business segment of $136.0 million. The failure of e-TeleQuote to achieve anticipated revenue and earnings levels could result in additional goodwill impairment charges. See “Item 1A. Risk Factors – Any acquisition of or investment in businesses that we may undertake that does not perform as we expect or that is difficult for us to integrate could adversely impact our business, financial condition and results of operations”.
e-TeleQuote, consistent with other Medicare Advantage distributors, has experienced elevated policy churn in recent years, which caused the ratio of lifetime value of commissions (“LTV”) to contract acquisition costs (“CACs”) to reach an undesirable level. Our inability to execute e-TeleQuote’s business strategy may adversely affect our business, financial condition and results of operations. In 2022 and 2023, the Company managed e-TeleQuote in such a way to eliminate the need for capital support from the ultimate parent company. Upon indication of improved performance and/or the expectation that the business will generate acceptable returns, we may
31
allow the future use of capital relating to the development and growth of e-TeleQuote’s business, including expenditures relating to lead acquisition, marketing, website and technology development, security, and hiring of additional employees.
e-TeleQuote’s success will depend on its ability to retain key management and hire, develop and retain highly skilled and qualified licensed health insurance agents who attain desired productivity levels. Failure to successfully perform any of the activities listed above could have a material adverse effect on e-TeleQuote’s business and results of operations, which could adversely affect our business.
e-TeleQuote is highly regulated and subject to compliance requirements of the United States government’s Centers for Medicare and Medicaid Services (“CMS”) and those of its carrier partners. Non-compliance with, or violations of, such requirements may harm its business, which could have a material adverse effect on our business, financial condition and results of operations.
e-TeleQuote’s business and operating results are heavily dependent on marketing and selling Medicare-related insurance plans. The marketing and sale of Medicare Advantage and Medicare Part D prescription drug plans are principally regulated by CMS and are also subject to state laws. The marketing and sale of Medicare Supplement plans are principally regulated by state insurance departments. These laws and regulations are numerous and complex, and CMS regulations and guidance frequently change.
CMS regulations require that many aspects of e-TeleQuote’s online platforms, marketing materials and processes, as well as changes thereto, including call scripts, be filed with CMS and reviewed and approved by carriers. In addition, certain aspects of Medicare plan marketing partner relationships are subject to CMS and carrier review. Further, some carriers provide e-TeleQuote with marketing development revenue, consistent with CMS regulations. Changes to applicable laws, regulations and guidelines, their interpretation or the manner in which they are enforced could be incompatible with carrier relationships, the manner in which e-TeleQuote conducts business, e-TeleQuote’s platforms, or the sale of Medicare plans, which could harm its business and materially adversely affect our business.
In October 2023, CMS proposed a rule that would limit certain forms of payments, such as fees for administrative services, that e-TeleQuote can receive from carriers. In addition, payments that e-TeleQuote receives would decline if: (i) other laws or regulations limit or remove the ability for carriers to provide funds to e-TeleQuote; (ii) federal or state governments determine that e-TeleQuote’s compensation or administrative payment arrangements with carrier providers do not meet regulatory requirements, or (iii) actions of federal or state governments result in a reduction in commissions paid to e-TeleQuote or impact the timing of revenue recognition in connection with the sale of Medicare related health insurance. Each of these could have a material adverse effect on e-TeleQuote’s business and operations.
CMS audits Medicare carriers and holds carriers responsible for actions of their subcontractors, downstream entities, and broker partners such as e-TeleQuote and its licensed health insurance agents. Federal or state governments may allege or determine that e-TeleQuote’s Medicare product sales, marketing or operations are not in compliance with Medicare or other requirements or give rise to excess complaints. As a result, carriers may terminate their relationships with e-TeleQuote or take other corrective action, which could harm its business and materially adversely affect our business.
e-TeleQuote generates leads that are internally sourced from marketing initiatives and receives referrals from Primerica independent sales representatives. It also receives leads externally acquired from third-party vendors. e-TeleQuote’s business may be harmed if it cannot continue to acquire or generate leads on commercially viable terms, if it is unable to convert leads to sales at acceptable rates, if Primerica independent sales representatives do not introduce consumers to e-TeleQuote, or if policyholder retention is lower than assumed, any of which could adversely impact our business.
e-TeleQuote’s business requires access to a large quantity of quality sales leads to keep its licensed health insurance agents productive. The business is also dependent upon a number of lead suppliers, including Internet search engines, from whom it obtains leads to support its sales of insurance policies. e-TeleQuote’s failure to generate quality sales leads internally or the loss of one or more lead suppliers could significantly limit its ability to access its target market.
e-TeleQuote may not be able to compete successfully for high quality leads against its current or future competitors, some of whom may have greater technical, marketing and other resources. If it fails to compete successfully with its competitors to source sales leads from lead suppliers, it may experience increased marketing costs and loss of market share.
Converting quality sales leads to policy sales is key to e-TeleQuote’s success. Many factors impact e-TeleQuote’s conversion rate, including the quality of leads, agent tenure, and its proprietary workflow technology. Any adverse impact on conversion rates could harm e-TeleQuote’s business, operating results, financial condition and prospects, which could adversely impact our business.
Primerica certifies certain of its independent sales representatives to receive fees for Senior Health services associated with introducing seniors to e-TeleQuote. If Primerica’s certified independent sales representatives do not educate consumers about
32
e-TeleQuote and make introductions, e-TeleQuote’s operating results and financial condition could be impacted, which could adversely impact our business.
e-TeleQuote records revenue at the time a policy is sold based on the expected lifetime value of commissions to be collected for that policy. The most important assumption used in determining the lifetime value of commissions is expected policyholder retention. If actual renewal activity for any given period is lower than the renewal assumptions included in the estimated lifetime value of commissions on issued policies, it could have a material adverse effect on e-TeleQuote’s business and could adversely impact our business.
If e-TeleQuote’s ability to enroll individuals during the Medicare annual election period (“AEP”) is impeded, its business may be harmed, which could adversely impact our business, financial condition and results of operations.
e-TeleQuote handles an increased volume of health insurance sales transactions in a short period of time during the Medicare AEP, which runs from mid-October through early December. As a result, e-TeleQuote must ensure that an adequate number of health insurance agents are timely licensed, trained and certified and have the appropriate authority to sell health insurance in various states and for a number of different health insurance carriers during this period. If e-TeleQuote’s ability to market and sell Medicare-related health insurance is constrained during a Medicare AEP for any reason, such as technology failures, reduced allocation of resources, any inability to timely employ, license, train, certify and retain agents to sell health insurance, interruptions in the operation of its website or systems, or disruptions caused by other external factors, such as the COVID-19 pandemic, e-TeleQuote could sell fewer policies, which could adversely impact our business and results of operations.
e-TeleQuote’s business is dependent on key carrier partners. The loss of a key carrier partner, or the modification of commission rates or underwriting practices with a key carrier partner, could harm its business, which could adversely impact our business, financial condition and results of operations.
e-TeleQuote derives a substantial portion of its revenue from a few key carrier partners. The agreements with key carrier partners to sell Medicare plans are typically terminable by carrier partners without cause upon short term advance notice. Should e-TeleQuote become dependent on fewer key carrier partner relationships (whether as a result of the termination of key carrier partner relationships, key carrier consolidation or otherwise), it may become more vulnerable to adverse changes in its relationships with key carrier partners, particularly in states where it distributes insurance from a relatively smaller number of key carrier partners or where a small number of key carrier partners dominate the market. The loss of business or the failure to retain a significant amount of business with any of our key carrier partners could adversely impact our business, financial condition and results of operations.
Commission rates from carriers are either set by each carrier or negotiated between e-TeleQuote and each carrier, and Medicare Advantage commission rates are subject to CMS regulation. Commission rates paid to e-TeleQuote are, for any given plan for a given customer, based on a number of factors, including: (i) the carriers offering those plans; (ii) the state of residence of the customer; (iii) the laws and regulations in the jurisdictions where the customer is located; (iv) the customer’s previous Medicare enrollment history (if any); and (v) the services provided by e-TeleQuote. Carriers have the right to alter these commission rates and their contractual relationships with e-TeleQuote on relatively short notice, including in certain instances by unilateral amendment of contracts relating to commission rates or otherwise. In October 2023, CMS proposed a rule that would constrain certain contract terms between carriers and their distribution partners related to fees for certain services provided by the distribution partners. If the rule is finalized and made effective as proposed, it could adversely affect the compensation e-TeleQuote may receive from key carrier partners.
Risks Related to Our Mortgage Distribution Business
Licensing requirements will impact the size of the mortgage loan sales force, which could adversely affect our mortgage brokerage business.
To offer mortgage loan products, independent sales representatives must be individually licensed as mortgage loan originators by the states in which they do business and, in some states, they must also be individually licensed as mortgage brokers. These licensing requirements include enrollment in the Nationwide Multistate Licensing System, application to state regulators for individual licenses, a minimum of 20 hours of pre-licensing education, an annual minimum of eight hours of CE, and the successful completion of both national and state tests or a national test with uniform state content. Compliance with these licensing regimes (including background and credit checks) have proven to be a barrier for many sales representatives. In addition, the tests have historically been challenging for the sales representatives to pass. Primerica Mortgage, LLC (“Primerica Mortgage”) must also be licensed at the company level as a mortgage broker (or equivalent) and, in almost all states, representatives’ offices must be licensed as branch offices. To offer mortgage loans in a state, independent sales representatives, offices, and Primerica Mortgage must be licensed as required by state law. These licenses must be renewed on an annual basis. Failure of independent sales representatives to obtain the required licenses and comply with ongoing licensing requirements would adversely affect the size of the mortgage loan sales force, which could adversely affect our mortgage distribution business.
33
Our mortgage brokerage business is highly regulated and subject to various federal, state and provincial laws and regulations in the U.S. and Canada. Changes in, non-compliance with, or violations of, such laws and regulations could affect the cost or our ability to distribute our products and could adversely affect our business, financial condition and results of operations.
Our U.S. mortgage brokerage business is subject to a wide array of laws at the federal, state, and local levels. It is regulated by federal, state and local regulators, including the Consumer Financial Protection Bureau, state mortgage and licensing regulators, state attorneys general, state and local consumer protection offices, the FTC, the Department of Housing and Urban Development, and the Department of Justice, which have the authority to examine, supervise, investigate, and enforce applicable laws, regulations and policies. Federal law and regulations impose prohibitions and restrictions on the manner and amount of compensation paid in connection with a mortgage loan transaction and establish a federal ability to repay standard for all mortgage loans. Other laws could have the effect of limiting the availability of certain loan products in the market and adversely impact the range of products offered and the volume of loan business.
Additionally, we must comply with various state and local laws and policies concerning the lender, compensation, fair lending, supervision, the provision of consumer disclosures, net branching, predatory lending and high cost loans and recordkeeping. Differing interpretations of, changes in, or violations of, any of these laws or regulations could subject us to damages, fines, or sanctions and could affect the cost or our ability to distribute our products, which could materially adversely affect our business, financial condition, and results of operations. Remediation for noncompliance with federal, state or local laws could be costly and significant fines may be incurred. Failure to comply with applicable laws could result in potential litigation liability. Further, the lender must comply with applicable federal, state, and local laws and regulations, and any noncompliance by such lender may adversely impact our U.S. mortgage distribution business.
In Canada, independent sales representatives offer mortgage loans on a referral basis only. Various provincial mortgage brokerage laws strictly prescribe the requirements applicable to a mortgage referral program in order for individuals who make the referrals to be exempt from the requirement to be licensed as mortgage brokers. Differing interpretations of, changes in, or violations of, any of the applicable exemptions under mortgage brokerage laws could subject us to damages, fines or sanctions and could have a material adverse effect on our ability to offer mortgage loan referrals in Canada. In addition, independent sales representatives selling mutual funds must comply with the disclosure requirements of the MFDA and applicable securities laws governing mortgage referral arrangements. Failure to comply with such disclosure requirements could result in regulatory sanctions, which could have an adverse effect on our ability to offer mortgage loan referrals in Canada.
In the United States, we distribute mortgage loans based on contractual agreements with a very limited number of mortgage lenders. A significant change to or disruption in the mortgage lenders’ mortgage businesses or an inability of the mortgage lenders to satisfy their contractual obligations to us could adversely affect our business, financial condition and results of operations.
Through a contractual agreement with Rocket Mortgage, LLC, Primerica Mortgage offers mortgage loans through our independent sales representatives who are licensed as mortgage loan originators. Beginning in late 2022, Primerica Mortgage also offers, through its mortgage loan originators, second mortgages and home equity lines of credit based on a contractual agreement with Spring EQ LLC. A significant change to or disruption in the lenders’ businesses or their inability to satisfy their contractual obligations to Primerica Mortgage could have an adverse impact on our business, financial condition and results of operations.
Risks Related to Economic Downcycles, Public Health Crises or Catastrophes, and Disasters
The effects of economic downcycles, issues affecting the national and/or global economy or global geopolitical event(s) could materially adversely affect our business, financial condition and results of operations.
Our business, financial condition and results of operations may be materially adversely affected by economic downturns in the United States and Canada, as well as issues in the national and/or global economy such as elevated inflation that may have repercussions on our local markets. Economic downturns, which are often characterized by conditions such as elevated inflation, declines in capital markets, higher unemployment, lower household income, lower valuation of retirement savings accounts, lower corporate earnings, lower business investment and/or lower consumer spending, can impact the disposable income of middle-income consumers, which can influence their investment and spending decisions. With respect to our term life insurance business, we may experience an elevated incidence of lapses or surrenders of term life insurance policies, and some of our policyholders may stop paying insurance premiums. Consumer spending and borrowing levels affect how consumers evaluate their savings and debt management plans. In 2023, interest rates, equity market returns and our customers’ perception of the strength of the capital markets continued to impact consumer demand for the savings and investment products we distribute. More specifically, elevated interest rates relative to the performance of the equity markets and the perceived attractiveness of investing in equity markets versus other investments, such as U.S. Treasury bills and money market funds, could adversely impact consumer demand for the mutual funds, annuities, and managed accounts we distribute. Continued elevated inflation has caused and may continue to cause higher labor costs and increased vendor and supplier costs. Economic conditions, including continued elevated inflation has impacted and may continue to impact prospective
34
recruits’ perceptions of the business opportunity that becoming an independent sales representative offers, which can drive or dampen recruiting. Similarly, these economic conditions can also affect e-TeleQuote’s ability to recruit and retain licensed health insurance agents.
Our investment and savings products business is sensitive to the performance of the equity markets. A protracted long-term downturn in equity market performance brought about by an economic downturn and/or global geopolitical event(s) could adversely affect new sales and cause clients to liquidate mutual funds and other investments sold by independent sales representatives. This could cause a decrease in the asset value of client accounts, reduce our trailing commission revenues and result in a decline in the fair value of our invested asset portfolio. Further, volatility or downturns in equity markets could dampen purchases of the investment products that we distribute and could have a material adverse effect on our business, including our ability to recruit and retain independent sales representatives.
Major public health pandemics, epidemics or outbreaks (such as the COVID-19 pandemic) or other catastrophic events, have impacted and could again materially adversely impact our business, financial condition and results of operations.
Our operations are exposed to the risk of major public health pandemics, epidemics or outbreaks (a “major public health crisis”), such as the COVID-19 pandemic, or other catastrophic events (“catastrophic events”), which, among other things, has caused and could again cause a large number of premature deaths of our insureds. Although we have ceded a significant majority of our mortality risk to reinsurers, a major public health crisis or catastrophic event could cause: (i) substantial volatility in our financial results for a period of time; (ii) material harm to the financial condition of our reinsurers; (iii) increases in the probability of default on reinsurance recoveries; (iv) decreases in the availability of reinsurance on new business; or (v) increases in reinsurance costs on new business and/or rates during the post-level term period. In addition, most of the jurisdictions in which our insurance subsidiaries are licensed to transact business require life insurers to participate in guaranty associations, which raise funds to pay contractual benefits owed pursuant to insurance policies issued by impaired, insolvent or failed issuers. A major public health crisis or catastrophic event could require extraordinary assessments on our insurance companies, which could have a material adverse effect on our business, financial condition and results of operations.
A major public health crisis or catastrophic event has impacted and could again negatively impact our ability to attract new recruits, train and license the independent sales force, and incentivize the independent sales force to sell our products. If a significant number of independent sales representatives were to be impacted by a major public health crisis or catastrophic event, it could have a material adverse effect on recruiting, licensing, and our ability to write new business. Similarly, a major public health crisis or catastrophic event could again impair our ability to hire, license, and train health insurance agents in our senior health business. A major public health crisis or catastrophic event could again cause significant volatility in global financial markets and disrupt the economy and the demand for the term life insurance, investment and savings, Medicare related insurance, and other financial products that we sell. Our investment portfolio and the valuations of invested assets we hold could also be materially adversely affected.
In the event of a disaster, our business continuity plan may not be sufficient, which could have a material adverse effect on our business, financial condition and results of operations.
Our infrastructure supports a combination of local and remote recovery solutions for business resumption in the event of a disaster, including a security incident. Our Canadian and U.S. operations (except for e-TeleQuote) utilize a data center located in our main campus in Duluth, Georgia. In the event of either a main campus destruction or the inability to access our data center or main campus in Duluth, Georgia, our business recovery plan provides for our employees to perform their work functions via a dedicated business backup/recovery site located about 20 miles from our main campus or by remote access from an employee’s home. In addition to this site, the Company uses a business resumption vendor that will provide the hardware required for recovery within a reasonable timeframe in the event of a disaster. However, in the event of main campus destruction, our business recovery plan may be inadequate, and our employees and the independent sales representatives may be unable to carry out their work immediately, which could have a material adverse effect on our business, financial condition and results of operations.
e-TeleQuote, with its main campus in Clearwater, Florida, has a separate business recovery and/or disaster recovery plan, which, in the event of e-TeleQuote’s main campus destruction, could be inadequate and could have a material adverse effect on e-TeleQuote’s business, financial condition and results of operations.
Risks Related to Information Technology and Cybersecurity
If one of our, or a third-party partner’s, significant information technology systems fails, if its security is compromised, or if the Internet becomes disabled or unavailable, our business, financial condition and results of operations may be materially adversely affected.
Our business is highly dependent upon the effective operation of our information technology systems and third-party technology systems, networks and clouds to record, process, transmit and store information, including sensitive customer and proprietary
35
information. We rely on these systems throughout our business for a variety of functions including to conduct many of our business activities and transactions with customers, independent sales representatives, vendors and other third parties, to prepare our financial statements and to communicate with our Board of Directors. Further, our information technology systems and applications run a variety of third-party and proprietary software intended to support the sales force. Our business also relies on the use by employees, independent sales representatives and other third parties of electronic mobile devices, such as laptops, tablets and smartphones, which are particularly vulnerable to loss and theft.
Maintaining the integrity of these systems and networks is critical to the success of our business operations, including the retention of independent sales representatives and customers, and to the protection of our proprietary information and our customers’ confidential and personal information. We could experience a failure of one or more of these systems or could fail to complete all necessary data reconciliation or other conversion controls when implementing new software systems. In addition, despite the implementation of security and back-up measures, our information technology systems may be vulnerable to physical or electronic intrusions, viruses or other attacks, programming errors and similar disruptions.
We are subject to international, federal, state, and provincial regulations, and in some cases contractual obligations, that require us to establish and maintain policies and procedures designed to protect sensitive customer, employee, independent sales representative and third-party information. We have implemented and maintain security measures, including industry-standard commercial technology, designed to protect against breaches of security and other interference with our systems and networks resulting from attacks by third parties, including hackers, and from employee or independent sales representative error or malfeasance. We continually assess our ability to monitor, respond to, and recover from such threats. We also require third-party vendors, who in the provision of services to us are provided with or process information pertaining to our business or our customers, to meet certain information security standards. Despite the measures we have taken and may in the future take to address and mitigate cybersecurity and technology risks, we cannot assure that our systems and networks will not be subject to breaches or interference. Any such breaches or interference by third parties or by independent sales representatives or employees that may occur in the future, including the failure of any one of these systems for any reason, could cause significant interruptions to our operations, which could have a material adverse effect on our
business, financial condition and results of operations.
Anyone who is able to circumvent our security measures and penetrate our information technology systems could access, view, misappropriate, alter, or delete information in the systems, including personally-identifiable client information, health information, and proprietary business information. In addition, an increasing number of regulators require that regulators and clients be notified if a security breach results in the disclosure of personally-identifiable client information or health information, which could exacerbate the harm to our business, financial condition or results of operations. We cannot be certain that advances in criminal capabilities, discovery of new vulnerabilities, attempts to exploit vulnerabilities in our systems, data thefts, physical system, network or cloud break-ins or inappropriate access, or other developments will not compromise or breach the technology or other security measures protecting the networks and systems used in connection with our business.
Operating system failures, ineffective system implementation, loss of the Internet or the compromise of security with respect to internal, external or third-party operating systems or electronic devices could subject us to significant civil and criminal liability, harm our reputation, interrupt our business operations, deter people from purchasing our products, require us to incur significant technical, legal and other expenses, and adversely affect our internal control over financial reporting, business, financial condition, or results of operations.
Any failure to protect the confidentiality of client information could adversely affect our reputation and have a material adverse effect on our business, financial condition and results of operations.
Various government bodies have established rules protecting the privacy and security of personal information, which vary significantly from jurisdiction to jurisdiction. Many independent sales representatives, employees, and third-party service providers have access to, and routinely process, personal information of clients on paper and on personal and Company-owned hardware, the cloud and mobile devices through a variety of media, including the Internet and software applications. We rely on internal processes and controls to protect the confidentiality of client information that is accessible to, or in the possession of, our Company, our employees and the independent sales representatives. If: (i) an independent sales representative, employee, or third-party service provider intentionally or unintentionally discloses or misappropriates confidential client information; (ii) our data is the subject of a cybersecurity attack; (iii) we fail to maintain adequate internal controls; or (iv) independent sales representatives, employees or third-party service providers fail to comply with our policies and procedures, then misappropriation or intentional or unintentional inappropriate disclosure or misuse of client information could occur. Such internal control inadequacies or non-compliance could materially damage our reputation or lead to civil or criminal penalties, which could have a material adverse effect on our business, financial condition and results of operations.
36
The current legislative and regulatory climate with regard to privacy and cybersecurity could adversely affect our business, financial condition, and results of operations.
Various international, federal and state legislative and regulatory bodies are considering or have considered, proposed, or adopted new standards and rules regarding protection of personally-identifiable information. All 50 U.S. states and Canada have breach notification requirements. NYDFS’s Cybersecurity Requirements for Financial Services Companies (“NYDFS Cybersecurity Requirements”) require covered financial services institutions to implement a cybersecurity program designed to protect information systems and data. The NYDFS also recently finalized material updated provisions to NYDFS Cybersecurity Requirements that could affect the compliance requirements of the Company and the independent sales representatives. The NAIC has adopted the Insurance Data Security Model Law (“Model Law”), which among other things, requires insurers and insurance producers to develop and maintain a written information security program, conduct risk assessments, and assess the data security practices of third-party service providers. The Model Law, which has some similarities as well as differences from the NYDFS Cybersecurity Requirements, has been adopted by a significant number of states. In addition, various regulators and legislators are proposing, have proposed, and have passed more stringent privacy requirements, including the California Consumer Privacy Act of 2018, its updates in the California Privacy Rights Act of 2023, and related regulations (“CCPA”). The CCPA is designed to give consumers more control over their personal data and imposes strict liability for security incidents under certain circumstances.
Such laws or regulations could require us to implement new technologies or revise and maintain policies and procedures designed to protect sensitive customer, employee, representative and third-party information. Being subject to, or out of compliance with, the aforementioned laws and regulations could result in material costs, fines, penalties or litigation, which could materially adversely affect our business, financial condition and results of operations.
e-TeleQuote’s security measures, which are designed to protect against breaches of security and other interference with its systems and networks, operate independently from Primerica’s systems. If e-TeleQuote is subject to cyber-attacks or security breaches or is otherwise unable to safeguard the security and privacy of confidential data, including personal health information, e-TeleQuote’s business may be harmed, which could have a material adverse effect on our business, financial condition and results of operations.
e-TeleQuote’s services involve the collection, processing, use, transmission, and storage of confidential and personal information of consumers and current and former employees, including protected health information subject to the Health Insurance Portability and Accountability Act of 1996 (“HIPAA”) and other individually identifiable health information. Accordingly, e-TeleQuote is subject to international, federal and state regulations, and in some cases contractual obligations, that require us to establish and maintain policies and procedures designed to protect HIPAA and other personal and sensitive information. e-TeleQuote has implemented and maintains certain security measures intended to protect against breaches of security and other interference with its systems and networks resulting from attacks by third parties, including hackers, and from employee or representative error or malfeasance. We have made and expect to continue making future expenditures relating to privacy and security to ensure that e-TeleQuote’s information security measures continue to align with industry information security standards.
Despite the measures e-TeleQuote has taken and may in the future take to address and mitigate cybersecurity and technology risks, we cannot be certain that its systems and networks will not be subject to breaches or interference. Any such breaches or interference by third parties or by licensed health insurance agents or employees that may occur in the future, including the failure of any one of these systems for any reason, could cause significant interruptions to its operations, damage its or our reputation, cause the termination of relationships with government-run health insurance exchanges, carriers, customers, and marketing partners, reduce demand for services and subject e-TeleQuote to significant liability and expense as well as regulatory action and lawsuits, any of which could have a material adverse effect on our business, financial condition and results of operations.
Financial Risks Affecting Our Business
Credit deterioration in, and the effects of interest rate fluctuations on, our invested asset portfolio and other assets that are subject to changes in credit quality and interest rates could materially adversely affect our business, financial condition and results of operations.
A large percentage of our invested asset portfolio is invested in fixed-income securities. As a result, credit deterioration and interest rate fluctuations could materially affect the value of and earnings generated by our invested asset portfolio. During periods of declining market interest rates, we must invest the cash we receive as interest, return of principal on our investments and cash from operations in lower-yielding, high-grade instruments or in lower-credit instruments to maintain comparable returns. Issuers of fixed-income securities could also decide to prepay their obligations to borrow at lower market rates, which would increase our reinvestment risk. If interest rates generally increase, the fair value of our fixed rate income portfolio decreases. Additionally, if the fair value of any security in our invested asset portfolio decreases, we may realize losses if we deem the value of the security to be impaired due to a credit loss. We also have an asset on deposit with a coinsurer backing a 10% coinsurance agreement entered into at the time of our
37
IPO. The fair value of this asset is influenced by fluctuation in credit spreads and interest rates, and changes in fair value are recognized in income. To the extent that any fluctuations in fair value or interest rates are significant or we recognize impairments that are material, it could have a material adverse effect on our business, financial condition and results of operations.
Valuation of our investments and the determination of expected credit losses when the fair value of our available-for-sale invested assets is below amortized cost are both based on estimates that may prove to be incorrect, which could adversely affect our financial condition.
Our portfolio of invested assets primarily consists of fixed-maturity securities that are classified as available-for-sale. When the fair value of any of our available-for-sale invested assets declines below amortized cost, an impairment exists and we recognize a loss in either our statement of income or in other comprehensive income based on our assessment of expected credit losses. The determination of the fair value of certain invested assets, particularly those that do not trade on a regular basis, requires an assessment of available data and the use of assumptions and estimates. Once it is determined that the fair value of an available-for-sale security is below its carrying value, we first determine if we intend to sell or will more-likely-than-not be required to sell the security before the expected recovery of its amortized cost. If we intend to sell or will more-likely-than-not be required to sell the security, then we recognize the impairment as a credit loss in our consolidated statements of income by writing down the security’s amortized cost to its fair value. If we do not intend to sell or it is not more-likely-than-not that we will be required to sell the security before the expected recovery of its amortized cost, we recognize the portion of the impairment that is due to a credit loss, if any, in our consolidated statement of income through an allowance. The portion of the impairment that is due to factors other than a credit loss is recognized in other comprehensive income in the consolidated statement of comprehensive income as an unrealized loss. The determination of whether an impairment is due to credit factors is subjective and involves a variety of assumptions and estimates.
There are various risks and uncertainties associated with determining whether an impairment is due to credit factors when the fair value of available-for-sale securities declines below amortized cost. To the extent that we are incorrect in our determination of the fair value of our investment securities or our determination of whether an impairment is due to credit factors for available-for-sale securities, we may realize losses that never actually materialize and are subsequently reversed, or may fail to recognize losses within the appropriate reporting period.
Changes in accounting standards can be difficult to predict and could adversely impact how we record and report our financial condition and results of operations.
Our accounting policies and methods are fundamental to how we record and report our financial condition and results of operations. U.S. GAAP is a continuously evolving set of financial accounting and reporting standards that governs the preparation of our financial statements. Changes to U.S. GAAP can be difficult to implement and can materially impact how we record and report our financial condition and results of operations. A recent change in U.S. GAAP that was effective on January 1, 2023 and impacted how we record and report our financial condition and results of operations is Accounting Standards Update No. 2018-12, Financial Services—Insurance (Topic 944) — Targeted Improvements to the Accounting for Long-Duration Contracts (“ASU 2018-12”). The amendments in this update changed the accounting guidance we follow for long-duration insurance contracts. ASU 2018-12 requires us to update assumptions used in measuring future policy benefits, including mortality, persistency, and disability rates, at least annually instead of locking those assumptions at contract inception. In addition, the new standard requires differences in assumptions and actual performance be reflected in reserves as the experience occurs. ASU 2018-12 also includes changes to how we amortize deferred policy acquisition costs and determine and update the discount rate assumptions used in measuring future policy benefits reserves while increasing the level of financial statement disclosures required. The amendments in ASU 2018-12 were effective for the Company beginning in 2023 as of the earliest period presented in the consolidated financial statements. The adoption of ASU 2018-12 has had a pervasive impact on our consolidated financial statements and related disclosures and required changes to certain of our processes, systems, and controls. Future financial reporting standard changes by the Financial Accounting Standards Board (“FASB”) and the SEC could adversely impact our ability to maintain effective control over financial reporting given the changes that are needed to adopt such standards.
Additionally, the Company’s insurance company subsidiaries prepare statutory financial statements in accordance with accounting principles designated by regulators in the jurisdictions in which they are domiciled. The financial statements of our U.S. insurance subsidiaries are prepared in accordance with statutory accounting principles (“SAP”) prescribed or permitted by state insurance departments and the NAIC. SAP, including actuarial methodologies for estimating reserves, are subject to continuous evaluation by the NAIC and state insurance departments. Similarly, our Canadian life insurance subsidiary is required to prepare statutory financial statements in accordance with IFRS, as prescribed by the OSFI in Canada. The International Accounting Standard Board’s new accounting standard for insurance contracts (“IFRS 17”) became effective on January 1, 2023. IFRS 17 significantly overhauls the measurement model for insurance contracts at our Canadian life insurance subsidiary for statutory reporting purposes. The statutory financial statements of our insurance company subsidiaries are used to determine dividend capacity and risk-based capital and are monitored closely by regulators. The complexities and novelty of IFRS 17 could adversely impact our ability to comply with the financial statement requirements stipulated by OSFI in Canada.
38
The inability of our subsidiaries to pay dividends or make distributions or other payments to us in sufficient amounts would impede our ability to meet our obligations and return capital to our stockholders.
Operations of the Company are conducted by its subsidiaries. As such, Primerica, Inc. is a holding company that has no significant operations. Our primary asset is the capital stock of our subsidiaries and our primary liability is our senior unsecured notes (the “Senior Notes”). We rely primarily on dividends and other payments from our subsidiaries to meet our operating costs, other corporate expenses, and Senior Note obligations, as well as to return capital to our stockholders. The ability of our subsidiaries to pay dividends to us depends on their earnings, covenants contained in existing and future financing or other agreements and on regulatory restrictions. The ability of our insurance subsidiaries to pay dividends will further depend on their statutory income and surplus. If the cash we receive from our subsidiaries pursuant to dividend payments and tax sharing arrangements is insufficient for us to fund our obligations or if a subsidiary is unable to pay dividends to us, we may be required to raise cash through the incurrence of debt, the issuance of equity or the sale of assets. However, given the risk of volatility in the capital markets, there is no assurance that we would be able to raise cash by these means.
The jurisdictions in which our insurance subsidiaries are domiciled impose certain restrictions on their ability to pay dividends to us. In the United States, these restrictions are based, in part, on the prior year’s statutory income and surplus. In general, dividends up to specified levels are considered ordinary and may be paid without prior approval. Dividends in larger amounts are subject to approval by the insurance commissioner of the state of domicile. In Canada, dividends can be paid, subject to the paying insurance company continuing to meet the regulatory requirements for capital adequacy and liquidity and upon 15 days’ minimum notice to OSFI. More stringent restrictions could be adopted from time to time by jurisdictions in which our insurance subsidiaries are domiciled, and such restrictions could have the effect, under certain circumstances, of significantly reducing dividends or other amounts payable to us by our subsidiaries without prior approval by regulatory authorities. In addition, in the future, we may become subject to debt covenants or other agreements that limit our ability to return capital to our stockholders. The ability of our insurance subsidiaries to pay dividends to us is also limited by our need to maintain the financial strength ratings of our subsidiaries assigned by the ratings agencies.
If any of our subsidiaries were to become insolvent, liquidate, or otherwise reorganize, we, as sole stockholder, will have no right to proceed against the assets of that subsidiary. Furthermore, with respect to our insurance subsidiaries, we, as sole stockholder, will have no right to cause the liquidation, bankruptcy, or winding-up of the subsidiary under the applicable liquidation, bankruptcy or winding-up laws, although, in Canada, we could apply for permission to cause liquidation. The applicable insurance laws of the jurisdictions in which each of our insurance subsidiaries is domiciled would govern any proceedings relating to that subsidiary. The insurance authority of that jurisdiction would act as a liquidator or rehabilitator for the subsidiary. Both creditors of the subsidiary and policyholders (if an insurance subsidiary) would be entitled to payment in full from the subsidiary’s assets before we, as the sole stockholder, would be entitled to receive any distribution from the subsidiary.
If the ability of our insurance or non-insurance subsidiaries to pay dividends or make other distributions or payments to us is materially restricted by regulatory requirements, bankruptcy, or insolvency, or our need to maintain our financial strength ratings, or is limited due to operating results or other factors, it could materially adversely affect our ability to fund our obligations and return capital to our stockholders.
Risks Related to Legislative and Regulatory Changes
We are subject to various federal, state and provincial laws and regulations in the United States and Canada, changes in which may require us to alter our business practices and could materially adversely affect our business, financial condition and results of operations.
Our business is subject to many regulations that relate to, among other things, consumer protection, fair credit reporting, financial privacy, consumer fraud, anti-money laundering, worker classification standards, corporate taxation, artificial intelligence or algorithmic underwriting, and transactions with certain countries. These laws and regulations often are subject to the political climate.
Changes in any of these laws or regulations may require additional compliance procedures, which could have a material adverse effect on our business, financial condition, and results of operations.
The current legislative and regulatory climate with regard to financial services may adversely affect our business, financial condition, and results of operations.
The volume of legislative and regulatory activity relating to financial services has increased substantially in recent years, and the level of enforcement actions and investigations by federal, state and provincial regulators may increase correspondingly. Legislative, regulatory and enforcement activity at the federal level may contribute to heightened activity at the state and provincial level. If we or the independent sales representatives become subject to new requirements or regulations, it could result in increased litigation, regulatory risks, changes to our business model, a decrease in the number of securities-licensed representatives, increased compliance
39
costs, or a reduction in the products we offer to our clients or the profits we earn, which could have a material adverse effect on our business, financial condition and results of operations.
Regulators could also adopt laws or interpret existing laws in a way that would require retroactive changes to our business, accounting practices, or redundant reserve financing structures. Any such retroactive changes could have a material adverse effect on our business, financial condition and results of operations.
Medicare Advantage is a product legislated and regulated by the United States government. If the enabling legislation and regulation or implementing guidance issued by CMS changes, e-TeleQuote’s business may be harmed, which could have a material adverse effect on our business, financial condition and results of operations.
e-TeleQuote’s business depends upon the public and private sector of the U.S. health insurance system, which is subject to a changing regulatory environment. Accordingly, the future financial performance of its business will depend in part on e-TeleQuote’s ability to adapt to regulatory developments, including changes in laws and regulations or changes to interpretations of such laws or regulations, especially laws and regulations governing Medicare.
Additionally, ongoing healthcare reform efforts and measures may expand the role or scope of government-sponsored coverage, such as single payer or so called “Medicare-for-All” proposals, and expansion of Medicare’s coverage to dental, vision and hearing. Reforms, if enacted, could have far-reaching implications for the health insurance industry. Some proposals would seek to eliminate the private marketplace, whereas others would expand a government-sponsored option to a larger population, change eligibility ages, or expand coverage. We are unable to predict the impact of potential healthcare reform initiatives on e-TeleQuote’s operations in light of substantial uncertainty regarding the likelihood of enactment, or the terms and timing of, any such reforms. We are also unable to predict the impact any such reforms may have on healthcare and health insurance industry beneficiaries.
Changes in laws, regulations and guidelines governing health insurance may also be incompatible with various aspects of e-TeleQuote’s business and require that it make significant modifications to its existing technology or practices, which may be costly and time-consuming to implement. Various aspects of healthcare reform could also cause carriers to discontinue certain health insurance products or prohibit carriers from distributing certain health insurance products in particular jurisdictions.
The current regulatory climate with regard to climate change may adversely affect our business, financial condition, and results of operations.
Activity by federal, state and provincial regulators relating to the possible impacts of climate change on companies and their constituents has resulted in heightened legislative and regulatory activity at the federal, state and provincial levels. For example, on March 21, 2022, the SEC proposed significant new disclosure requirements to enhance and standardize climate-related disclosures (the “SEC Climate-Related Disclosures proposal”). In general, the SEC Climate-Related Disclosures proposal focuses on three main areas: (i) climate-change related risks (including risk identification/impact, governance, oversight/risk management and mitigation); (ii) greenhouse gas emissions (“GHG”) (Scope 1 and 2, and if material, Scope 3); and (iii) climate-related financial statement metrics (including a description of climate impacts in the notes to the audited financial statements). The timing of a final climate-related disclosures rule and its effective date are uncertain. Depending on the nature of the final rule, preparation of new disclosures may require significant assistance from third-party vendor(s), for which there may be high demand and limited availability.
On October 7, 2023, California enacted The Climate Corporate Accountability Act (“SB 253”) and The Climate-Related Financial Risk Act (“SB 261”), which impose extensive new climate-related reporting requirements on any U.S. business entity with annual revenues over $1 billion and $500 million (for SB 253 and SB 261, respectively) doing business in California. SB 253 requires disclosure of Scope 1 and 2 GHG emissions beginning in 2026 and Scope 3 GHG emissions beginning in 2027. SB 261 requires covered entities to biennially report on climate-related financial risk and measures adopted to reduce and adapt to such risk; however, the Company appears to be exempt from SB 261 because it already completes the Climate Risk Disclosure Survey, an annual survey administered by the California Department of Insurance. The Company is awaiting clarification as to whether the Company is exempt from SB 261. In addition, on March 7, 2023, OFSI issued its final Guideline-15, which sets out expectations for the management and disclosure of climate-related risks for federally regulated financial institutions in Canada, including disclosure of Scope 1, 2 and 3 GHG emissions by the end of 2025. Compliance with SB 253, SB 261, Guideline-15 and any other climate disclosure rules applicable to the Company may require significant assistance from third-party vendor(s). Factors that could adversely impact our ability to comply with any new climate disclosure rules include, but are not limited to, failure to secure the assistance of a third-party vendor(s), inability to gather the requisite data in a timely manner or at all, and/or significant associated financial costs.
General Risk Factors
Litigation and regulatory investigations and actions may result in financial losses and harm our reputation.
40
We face a risk of litigation and regulatory investigations and actions in the ordinary course of operating our businesses. From time to time, we are subject to private litigation as a result of alleged sales representative misconduct or alleged failure of the Company to follow applicable insurance, securities or other laws or regulations. If we become subject to any such litigation, the associated legal expense and any judgment or settlement of the claims could have a material adverse effect on our business, financial condition and results of operations.
We are also routinely subject to regulatory inquiries, such as information requests, subpoenas and books and record examinations, from state, provincial and federal regulators and other authorities and from time to time, regulatory investigations as a result of alleged sales representative misconduct or alleged failure of the Company to follow applicable laws or regulations. A substantial legal liability or a significant regulatory action against us could have a material adverse effect on our business, financial condition and results of operations.
Moreover, even if we ultimately prevail in any litigation, regulatory action or investigation, we could suffer significant reputational harm and we could incur significant legal expenses, either of which could have a material adverse effect on our business, financial condition and results of operations. In addition, increased regulatory scrutiny and any resulting investigations or proceedings could result in new legal precedents and industry-wide regulations or practices that could materially adversely affect our business, financial condition and results of operations.
A significant change in the competitive environment in which we operate could negatively affect our ability to maintain or increase our market share and profitability.
We face competition in all of our business lines. Our competitors include financial services companies, banks, investment management firms, broker-dealers, registered investment advisers, insurance companies, insurance brokers, direct sales companies, and technology companies. In many of our product offerings, we face competition from competitors that may have greater market share or breadth of distribution, offer a broader range of products, services or features, assume a greater level of risk, have lower profitability expectations, have lower fee and expense ratios, have higher financial strength ratings, offer more robust digital tools and self-service capabilities than we do or made use of emerging technologies more fully or rapidly than us. More recently, significant capital has been invested in direct-to-consumer offerings, including wealth management, retirement and life insurance products. In addition, regulatory changes and competitive factors are leading to innovations in product offerings and compensation structures. To the extent these entrants create a significant change in the competitive environment, our ability to maintain or increase our market share and profitability could be materially adversely affected.
Primerica’s continued success requires a high-performing and stable team of employees across all levels, and the loss of key employees could negatively affect our financial results and impair our ability to implement our business strategy.
In addition to intense competition for talent, workforce dynamics are constantly evolving. A disproportionate loss of staff can negatively impact morale, productivity and service levels. If the Company does not manage these changing workforce dynamics effectively, leading to prolonged employee attrition, it could materially adversely affect the Company’s financial condition and inhibit our long-term business strategy.
Further, our success substantially depends on our ability to attract and retain members of our senior management team. The efforts, level of engagement, and leadership of our senior managers have been, and will continue to be, critical to our success. Many of our most senior managers are very tenured and we expect increased instances of retirement in 2024 and 2025. The loss of service of members of our senior management team for any reason and without adequate succession planning and talent management could reduce our ability to successfully motivate the independent sales representatives or implement our business plan which could have a material adverse effect on our business, financial condition and results of operations. Although our executive officers have entered into employment agreements with us, there is no assurance that they will complete the term of their employment agreements or that such agreements will be renewed.
We regularly undertake business initiatives to enhance our technology, products, and services. The efficiency and success of these initiatives may vary significantly and may cause unanticipated costs, errors, or disruptions which could have a material adverse effect on our business, financial condition and results of operations.
We regularly evaluate and undertake business initiatives to improve and support our competitiveness and grow our business. Business initiatives that we are currently developing or executing, for example, include enhancements to information technology, our client relationship manager tool, and other systems, updates to our client and representative-facing software tools and applications, and streamlining of our off-channel communications systems. Our ability to implement these initiatives often may be dependent on our ability to integrate systems, develop and invest in new technologies and evolve existing methods and tools. The execution of these initiatives also may depend on our ability to change vendors, and implementation of certain initiatives may be dependent on third parties. In addition, these initiatives may take longer than anticipated to implement, and our ability to execute these initiatives in a timely manner
41
may impact the outcomes. Likewise, technological and other changes made in connection with these initiatives may result in increased or unanticipated costs, inadvertent data disclosures, operating errors, disruptions to our business, or may present other unanticipated technical or operational hurdles. The expansion of services or changes of vendors may involve client, regulatory and other third-party data use, storage and security challenges, as well as other regulatory compliance, business continuity and other considerations. As a result, we may not achieve some or all of the anticipated benefits or other intended results associated with these initiatives, which could have a material adverse effect on our business, financial condition and results of operations.
We may be materially adversely affected by currency fluctuations in the United States dollar versus the Canadian dollar.
The Canadian dollar is the functional currency for our Canadian subsidiaries and our financial results, reported in U.S. dollars, are affected by changes in the currency exchange rate. The assets, liabilities, revenues, and expenses of our Canadian subsidiaries are generally all denominated in Canadian dollars. However, the Canadian dollar financial statements of our Canadian subsidiaries are translated into U.S. dollars in our consolidated financial statements. Therefore, significant exchange rate fluctuations between the U.S. dollar and the Canadian dollar could have a material adverse effect on our financial condition and results of operations. A weaker Canadian dollar relative to the U.S. dollar would result in lower levels of reported revenues, expenses, net income, assets, liabilities and accumulated other comprehensive income as translated in our U.S. dollar reporting currency financial statements. In addition, our net investment in our Canadian subsidiaries is significantly affected by fluctuations in the exchange rate between the U.S. dollar and the Canadian dollar.
Any acquisition of or investment in businesses that we may undertake that does not perform as we expect or that is difficult for us to integrate could materially adversely impact our business, financial condition and results of operations.
At any particular time, we may be in various stages of assessment, discussion, and negotiation with regard to one or more potential acquisitions or investments, not all of which will be consummated. Acquisitions involve numerous risks and uncertainties and may be of businesses in which we lack operational or market experience. If we complete one or more acquisitions, our results of operations and financial condition may be adversely affected by a number of factors, including but not limited to: regulatory or compliance issues that could arise; a rating downgrade by a rating agency if it perceives an adverse change in our financial condition; changes in regulations and laws; the failure of the acquired businesses to achieve the results we have projected in either the near or long term, which could result in additional goodwill impairment charges; the assumption of unexpected liabilities, including litigation risks; the difference between the estimated and actual fair value of assets acquired and liabilities assumed; the difficulties of imposing adequate financial and operating controls on the acquired companies and their management and the potential cost that might be incurred to implement adequate controls; the difficulties in the integration of the operations, technologies, services and products of the acquired companies; and the failure to achieve the strategic objectives of these acquisitions. Further, completion of one or more acquisitions may cause our Board to suspend the payment of dividends and/or share repurchases. For example, we paused our share repurchase program in 2021 to accumulate cash used to fund the acquisition of e-TeleQuote and restarted after closing the acquisition.
If e-TeleQuote does not perform as expected, it could materially adversely affect our business, financial condition and results of operations. See “Item 1A. Risk Factors – Risks Related to e-TeleQuote’s Senior Health Insurance Distribution Business” above.
The market price of our common stock may fluctuate.
The stock market in general, and the market for companies in the financial services industry in particular, have experienced extreme price and volume fluctuations that have often been unrelated or disproportionate to the operating performance of these companies. Also, broad market and industry factors may negatively affect the market price of our common stock, regardless of our actual operating performance. Our stock could be subject to wide fluctuations in price in response to various factors, many of which are beyond our control.
ITEM 1B. UNRESOLVED STAFF COMMENTS.
Not applicable.
ITEM 1C. CYBERSECURITY.
Risk Management and Strategy
Primerica has processes in place aimed at assessing, identifying, and managing material risks from cybersecurity threats. Cybersecurity risk is integrated into Primerica’s enterprise risk management system. Primerica’s enterprise risk management and internal audit functions conduct regular assessments and audits of risks from cybersecurity threats and report the results to the Board of Directors at least quarterly. The Board considers cybersecurity risk as part of its business strategy, risk management, and financial oversight.
42
Primerica institutes a three-lines-of-defense model for information security risk assurance, in which management owns the risk, our enterprise risk management team assesses the risk and oversees compliance with internal guidelines and policies, and our internal audit team reviews the effectiveness of the first two lines of defense. Management works with external assessors, consultants, auditors, and other third parties from time to time in conducting maturity and technical assessments.
Primerica has processes in place to oversee and identify material risks from cybersecurity threats associated with its use of third-party service providers. The Company maintains a policy governing information security, which includes risk assessment policies and procedures relating to third-party vendors, as well as a data loss prevention policy. The Company’s policies address technical requirements needed to protect the environments in which data is processed, as well as how it is maintained, governed, and protected. Primerica also imposes mandatory privacy and information security controls and data security protection requirements on the independent contractor sales force. We train all regular employees in information security and privacy-related risks and we perform regular tests to determine whether our employees can recognize phishing emails. Similarly, our annual compliance training for the independent sales representatives includes training on maintaining data security and privacy. e-TeleQuote operates under certain of its own separate policies and procedures related to physical and information security. These policies and procedures are similar in nature to the ones discussed above.
We have an incident response plan designed to help us monitor the prevention, detection, mitigation, and remediation of information security incidents. The incident response plan documents the roles and responsibilities of Primerica personnel in responding to information security incidents, including the process by which the Chief Information Security Officer, the Chief Information Officer, senior management, and the Board is informed about such incidents.
The Chief Information Security Officer leads the Company’s Incident Advisory Committee (“IAC”), which is notified in the event of high or medium severity incidents. The IAC includes representatives from information technology, legal, and often the impacted business unit. The Incident Response Team (“IRT”) consists of the IAC and a larger group of managers that is typically notified of more significant incidents. The IRT reports findings to management and the Board as necessary. Each IRT member has specific responsibilities related to his or her function at the Company. On a semi-annual basis, the IRT and management undertake facilitator-led trainings and simulations of information security incidents.
Previous cybersecurity incidents have not materially affected the Company. For a discussion of risks to the Company related to cybersecurity threats, see “Item 1A. Risk Factors – Risks Related to Information Technology and Cybersecurity”, which is incorporated herein by reference.
Governance
The Board of Directors has responsibility for oversight of risks from cybersecurity threats. The Board receives a quarterly report from the Chief Information Officer and Chief Information Security Officer on risks from cybersecurity threats and, under the Company’s incident reporting plan, the Board is informed by management of certain cybersecurity incidents as appropriate. In 2023, the Board participated in a facilitator-led training and simulation of an information security incident.
Primerica’s senior executive leadership is actively involved in managing material risks from cybersecurity threats. Primerica’s cybersecurity operations risk steering group is chaired by the Chief Operating Officer and holds quarterly meetings. It includes key executives from the Company’s technology, security, privacy, and legal teams, coordinates corporate security initiatives and provides high-level guidance on technology-and security-related issues. The Chief Information Security Officer has responsibility for assessing and managing the Company’s material risks from cybersecurity threats. The Chief Information Security Officer has served in various roles in information technology and information security for 35 years, including serving as the Company's Chief Information Security Officer for over 23 years.
ITEM 2. PROPERTIES.
Our executive offices and business operations are housed primarily at our home office facility located in Duluth, Georgia. Our home office facility consists of approximately 345,000 square feet of general office space where our primary business operations are maintained including our information technology infrastructure and our media production studios. The lease for this building originally was to expire in June 2028 but, in May 2023, the lease was extended to December 31, 2035. This office space is used by all of our operating segments.
We also maintain a regional head office location for our Canadian operations in Mississauga, Ontario. Our Canadian head office location consists of general office space under a lease expiring in October 2030. This office space is primarily used by the Term Life Insurance, Investment and Savings Products and Corporate and Other Distributed Products segments.
43
We lease general office space for our NBLIC subsidiary in Long Island City, New York under a lease expiring in March 2030. This office space is primarily used by the Corporate and Other Distributed Products segment.
We lease general office space for our e-TeleQuote subsidiary’s headquarters in Clearwater, Florida, under a lease expiring in October 2024. This office space is primarily used by the Senior Health segment.
We believe that our existing facilities in the U.S. and Canada are adequate for our current requirements and for our operations for the foreseeable future.
ITEM 3. LEGAL PROCEEDINGS.
We are involved from time to time in legal disputes, regulatory inquiries and arbitration proceedings in the normal course of business. Additional information regarding certain legal proceedings to which we are a party is described under “Contingent Liabilities” in Note 17 (Commitments and Contingent Liabilities) to our consolidated financial statements included elsewhere in this report, and such information is incorporated herein by reference. As of the date of this report, we do not believe any pending legal proceeding to which Primerica or any of its subsidiaries is a party is required to be disclosed pursuant to this item.
ITEM 4. MINE SAFETY DISCLOSURES.
Not applicable.
ITEM X. INFORMATION ABOUT OUR EXECUTIVE OFFICERS AND CERTAIN SIGNIFICANT EMPLOYEES
The name, age at February 28, 2024, and position of each of our executive officers and certain significant employees are presented below. These officers comprise our senior management team.
Name |
|
Age |
|
Position |
Glenn J. Williams |
|
64 |
|
Chief Executive Officer |
Peter W. Schneider |
|
67 |
|
President |
Tracy X. Tan |
|
53 |
|
Executive Vice President and Chief Financial Officer |
Gregory C. Pitts |
|
61 |
|
Executive Vice President and Chief Operating Officer |
John A. Adams |
|
65 |
|
Chief Executive Officer of Primerica Life Insurance Company of Canada |
Michael C. Adams |
|
67 |
|
Executive Vice President and Chief Business Technology Officer |
Lisa A. Brown |
|
54 |
|
Executive Vice President and Chief Administrative Officer |
Jeffrey S. Fendler |
|
67 |
|
Executive Vice President and Chief Compliance and Risk Officer |
Kathryn E. Kieser |
|
54 |
|
Executive Vice President and Chief Reputation Officer |
Michael W. Miller |
|
46 |
|
Executive Vice President, President of Primerica Mortgage, LLC and Executive Chairman of Primerica Health, Inc. |
Robert H. Peterman, Jr. |
|
58 |
|
Executive Vice President and Chief Distribution Officer |
Alison S. Rand |
|
56 |
|
Executive Vice President |
Brett A. Rogers |
|
58 |
|
Executive Vice President and General Counsel |
Julie A. Seman |
|
54 |
|
Executive Vice President and Chief Marketing and Innovation Officer |
Set forth below is biographical information concerning our executive officers, who are elected by our Board of Directors and serve subject to their respective employment agreements.
Glenn J. Williams has served as Chief Executive Officer since April 2015. He served as President from 2005 through March 2015, as Executive Vice President of Field and Product Marketing for international operations from 2000 to 2005, as President and Chief Executive Officer of Primerica Canada from 1996 to 2000, and in roles of increasing responsibility as part of Primerica’s international expansion team in Canada from 1985 to 2000. He began his career with Primerica in 1981 as a member of the Company’s sales force and joined the home office team in 1983. Mr. Williams earned his B.S. degree in education from Baptist University of America. He served on the board of trustees for the Georgia Baptist Foundation from 2019 to 2023.
Peter W. Schneider has served as President since April 2015. He served as Executive Vice President, General Counsel, and Chief Administrative Officer from 2000 to April 2015 and as Corporate Secretary from 2000 through January 2014. He began his professional career as an Associate at the law firm of Paul, Weiss, Rifkind, Wharton & Garrison and worked as a Partner at the law firm of Rogers & Hardin LLP in Atlanta, Georgia from 1988 to 2000. Mr. Schneider earned both his B.S. degree in political science and industrial relations and his J.D. from the University of North Carolina at Chapel Hill. He serves on the Advisory Council of the Securities Industry and Financial Markets Association (SIFMA), the board of directors of Camp John W. Hanes (YMCA), the board of visitors of the University of North Carolina at Chapel Hill and the National Commission of the Anti-Defamation League.
Tracy X. Tan has served as Executive Vice President and Chief Financial Officer since December 2023. She joined Primerica in October 2023 as Executive Vice President, Finance. Prior to joining Primerica, Ms. Tan served as Chief Financial Officer of Strategic Link Consulting (SLC), a fintech enterprise offering turnkey solutions, lending platform and risk management services, from November 2018 to October 2023. At SLC, she was responsible for overseeing economic and business strategy, financial management,
44
planning and analysis, controllership, treasury, investor relations, tax, audits, and capital markets for all lines of business. During portions of her tenure at SLC, she also headed the Strategy and Human Resources functions. From December 2015 to January 2018, Ms. Tan was Senior Vice President and Chief Financial Officer for Assurant Global Housing, a subsidiary of Assurant, Inc., an insurance and financial services company. From October 2013 to December 2015, she served as Vice President of Finance and Divisional CFO for Novelis North America, a subsidiary of Novelis Inc., a global leader in rolled aluminum. From September 2005 to September 2013, she was Vice President of Finance and Divisional CFO for the Electrical and Industrial Divisions of Southwire Company, a top global wire and cable producer. Ms. Tan began her career at General Electric Company (GE) in 1996, where she held various roles with increasing responsibilities across four industries through 2005, including her last role, from July 2003 to August 2005, as Vice President and Chief Financial Officer for GE Intelligent Platform Embedded Systems. Ms. Tan holds a B.A. degree in English Language Arts from Xi’an International Studies University, China and an M.B.A. degree from Bowling Green State University. She is also an alumna of GE’s Experienced Financial Leadership Program and Financial Management Program.
Gregory C. Pitts has served as Executive Vice President and Chief Operating Officer since December 2009, as Executive Vice President since 1995 with responsibilities within the Term Life Insurance and Investment and Savings Products segments, and the information technology division and in various capacities at the Company since 1985. Mr. Pitts earned his B.S.B.A. degree in general business from the University of Arkansas. He serves on the board of directors of the Boy Scouts of America Atlanta Area Council.
Set forth below is biographical information concerning certain significant employees, who are elected by our Board of Directors.
John A. Adams has served as the Chief Executive Officer of Primerica Life Canada since 2003. He previously served Primerica Life Canada as Chief Financial Officer and before that as Vice President of Finance. Before joining Primerica, Mr. Adams served as the Director of Finance of a major Canadian university and Treasurer of an insurance group of companies. He began his career in 1980 with KPMG LLP. He graduated from Trinity College at the University of Toronto with a Bachelor of Commerce degree, and is a Chartered Accountant and Chartered Professional Accountant. Mr. Adams has provided industry leadership as a board member of the Investment Funds Institute of Canada (the mutual fund industry association) since 2005, having served as its Board Chairman from 2015 to 2017. He also serves as a board member of the Federation of Mutual Fund Dealers.
Michael C. Adams has served as Executive Vice President responsible for business technology since 1998 and as Chief Business Technology Officer since April 2010. He was Co-Head of Business Technology from December 2017 to May 2021 and served in various capacities at the Company since 1980. Mr. Adams earned his B.A. degree in business and economics from Hendrix College in 1978.
Lisa A. Brown has served as Executive Vice President and Chief Administrative Officer since October 2020. She oversees the Company’s Human Resources, Talent Management, Facilities and Physical Securities functions and leads the Company’s efforts to create and implement programs, processes and protocols that focus on DEIB. She also works closely with Marketing leaders to support our Strategic Markets affinity groups in the field. Prior to joining Primerica, Ms. Brown held several leadership positions at Delta Air Lines for more than 20 years overseeing the Human Resources function for Delta’s wholly-owned subsidiaries, talent development and multiple operations functions. She earned her B.S. degree in Human Resources Administration from Michigan State University and a Masters of Business Administration from Kennesaw State University. Ms. Brown serves on the Business Advisory Board of the Michigan State University Broad College of Business, is co-chair of the LEAD mentorship committee of the Atlanta Alumni Chapter of Delta Sigma Theta Sorority, Inc., and is chair of the development committee of the board of directors of Cool Girls, Inc.
Jeffrey S. Fendler has served as Executive Vice President and Chief Compliance and Risk Officer of the Company since February 2014. He served as President of Primerica Life from 2005 through January 2014 and in various capacities at the Company since 1980. Mr. Fendler received a B.A. degree in economics from Tulane University.
Kathryn E. Kieser has served as Executive Vice President and Chief Reputation Officer of Primerica, Inc. and President and Chair of the Primerica Foundation since January 2019. Previously, she served as Executive Vice President of Investor Relations from April 2010 to December 2018. Ms. Kieser joined Primerica in October 1995 and has held many positions over her career including Vice President of Sales and Product Marketing, Senior Vice President of Auto and Homeowners Insurance, and Chief Marketing Officer for Primerica Life Insurance Company. Ms. Kieser earned her B.S. degree in Business Administration from Auburn University and a Master of Science degree from Georgia State University. She serves on the boards of directors for the Gwinnett Chamber of Commerce and the Community Foundation for Northeast Georgia and on the board of advisors for the Metro Atlanta Chamber of Commerce.
Michael W. Miller has served as Executive Vice President since 2015, President of Primerica Mortgage, LLC since January 2018 and Executive Chairman of Primerica Health, Inc. since July 2021. He served as Head of Corporate Development and Strategic Planning from September 2015 to August 2021. Prior to joining Primerica, Mr. Miller was senior investment banker at Lazard from 2006 to September 2015, where he specialized in providing strategic advice to a broad array of financial institutions and their regulators. While at Lazard, Mr. Miller advised on over $85 billion of successful transactions and restructuring assignments. Mr. Miller also worked in the insurance industry in various capacities. He holds a B.S. degree from Brigham Young University in Business Administration and Finance and earned the Chartered Property & Casualty Underwriter designation.
Robert H. Peterman, Jr. has served as Executive Vice President and Chief Distribution Officer since March 2023. He previously served as Executive Vice President and Chief Marketing Officer from June 2018 to March 2023. He served as President of Primerica
45
Distribution from December 2013 to June 2018, where he was responsible for recruiting, licensing, licensing education, field compensation, field equity, and decision support. In 2005, he became Executive Vice President and was given responsibility for the Company’s Grow the Sales Force initiative. He also served as Chief Executive Officer of Primerica’s New York Life Insurance Company from January 2017 to June 2018. Mr. Peterman joined the Company in October 1984 and has served in many varying roles throughout the business.
Alison S. Rand has served as Executive Vice President since 2000. She served as Chief Financial Officer from 2000 to December 2023 and in various capacities at the Company from 1995 to 2000. Prior to 1995, Ms. Rand worked in the audit department of KPMG LLP. Ms. Rand earned her B.S. degree in accounting from the University of Florida and is a certified public accountant. Ms. Rand has served on the board of directors of Regions Financial Corporation since October 2023 and served on the board of directors of Warburg Pincus Capital Corporation I-A, a special purpose acquisition company, from July 2021 to March 2023. She is a member of the University of Florida National Foundation and serves as Vice Chair the University of Florida Warrington College of Business Dean’s Advisory Council. She is also a member of the Executive Committee of the board of directors of Junior Achievement of Georgia and serves on the University of Georgia Terry College of Business Executive Education CFO Roundtable Advisory Board.
Brett “Ben” A. Rogers has served as Executive Vice President and General Counsel since May 2019. Previously, he was a Partner at Rogers & Hardin LLP in Atlanta, Georgia, where he represented Primerica as outside counsel for more than 20 years. At Rogers & Hardin, his practice focused on complex business matters, including securities litigation, arbitration, and general commercial litigation. Mr. Rogers received a B.A. degree from Dickinson College and his J.D. with honors from Florida State University.
Julie A. Seman has served as Executive Vice President and Chief Marketing and Innovation Officer since March 2023, overseeing, in addition to her previous areas of responsibility, marketing of our investment and savings business. She previously served as Executive Vice President and Chief Marketing Officer of Field Distribution, Digital Distribution, Primerica Life, Client Solutions, and Strategic Markets from May 2018 to March 2023. From August 2014 she has been responsible for sales force growth and increased product distribution through the training and development of financial services representatives in the United States, Canada, Puerto Rico and Guam. In addition, Ms. Seman supports Primerica’s strategic markets which include African American, Hispanic, Partnership and Women with a focus on personal financial education and entrepreneurship. Prior thereto, she was Senior Vice President of Client Solutions from April 2010 to August 2014 where she supervised all front-end products, including Auto & Home Marketing and Legal Protection and oversaw field communication tools. Ms. Seman joined the Company in September 1998 and has served in many roles with increasing responsibility. Ms. Seman received her B.S. degree in Business Management from Southern Illinois University.
46
PART II
ITEM 5. MARKET FOR REGISTRANT’S COMMON EQUITY, RELATED STOCKHOLDER MATTERS AND ISSUER PURCHASES OF EQUITY SECURITIES.
Market Information
Our common stock is listed for trading on the New York Stock Exchange (“NYSE”) under the symbol “PRI.”
Holders
As of January 31, 2024, we had 168 holders of record of our common stock.
Dividends
In the first quarter of 2024, we declared a quarterly dividend to stockholders of $0.75 per share. We currently expect to continue to pay comparable quarterly cash dividends to holders of our common stock. Our payment of cash dividends is at the discretion of our Board of Directors in accordance with applicable law after taking into account various factors, including our financial condition, operating results, current and anticipated cash needs and plans for growth. Under Delaware law, we can only pay dividends either out of surplus or out of the current or the immediately preceding year’s earnings. Therefore, no assurance is given that we will continue to pay any dividends to our common stockholders, or as to the amount of any such dividends.
Issuer Purchases of Equity Securities
Depending on market conditions, shares of our common stock may be repurchased from time to time at prevailing market prices through open market or privately negotiated transactions.
The Parent Company has no obligation to repurchase any shares. Subject to applicable corporate and securities laws, repurchases may be made at such times and in such amounts as management deems appropriate. Repurchases under a publicly announced program can be discontinued at any time if management believes additional repurchases are not warranted.
During the quarter ended December 31, 2023, we repurchased shares of our common stock as follows:
Period |
|
Total number of shares purchased (1) |
|
|
Average price paid per share (1) |
|
|
Total number of shares purchased as part of publicly announced plans or programs (2) |
|
|
Approximate dollar value of shares that may yet be purchased under the plans or programs (2)(3) |
|
||||
October 1 - 31, 2023 |
|
|
324,633 |
|
|
$ |
198.93 |
|
|
|
324,182 |
|
|
$ |
8,046,834 |
|
November 1 - 30, 2023 |
|
|
39,984 |
|
|
|
202.89 |
|
|
|
39,668 |
|
|
|
425,000,000 |
|
December 1 - 31, 2023 |
|
|
- |
|
|
|
- |
|
|
|
- |
|
|
|
425,000,000 |
|
Total |
|
|
364,617 |
|
|
$ |
199.37 |
|
|
|
363,850 |
|
|
$ |
425,000,000 |
|
For more information on our share repurchases, see Note 13 (Stockholders’ Equity) to our consolidated financial statements included elsewhere in this report.
Stock Performance Table (1)
The following graph compares the performance of our common stock to the S&P MidCap 400 Index and the S&P 500 Insurance Index by assuming $100 was invested in each investment option as of December 31, 2018 and the reinvestment of all dividends. The S&P MidCap 400 Index measures the performance of the United States middle market capitalization (“mid-cap”) equities sector. The
47
S&P 500 Insurance Index is a capitalization-weighted index of domestic equities of insurance companies traded on the NYSE and NASDAQ. Our common stock is included in the S&P MidCap 400 index.
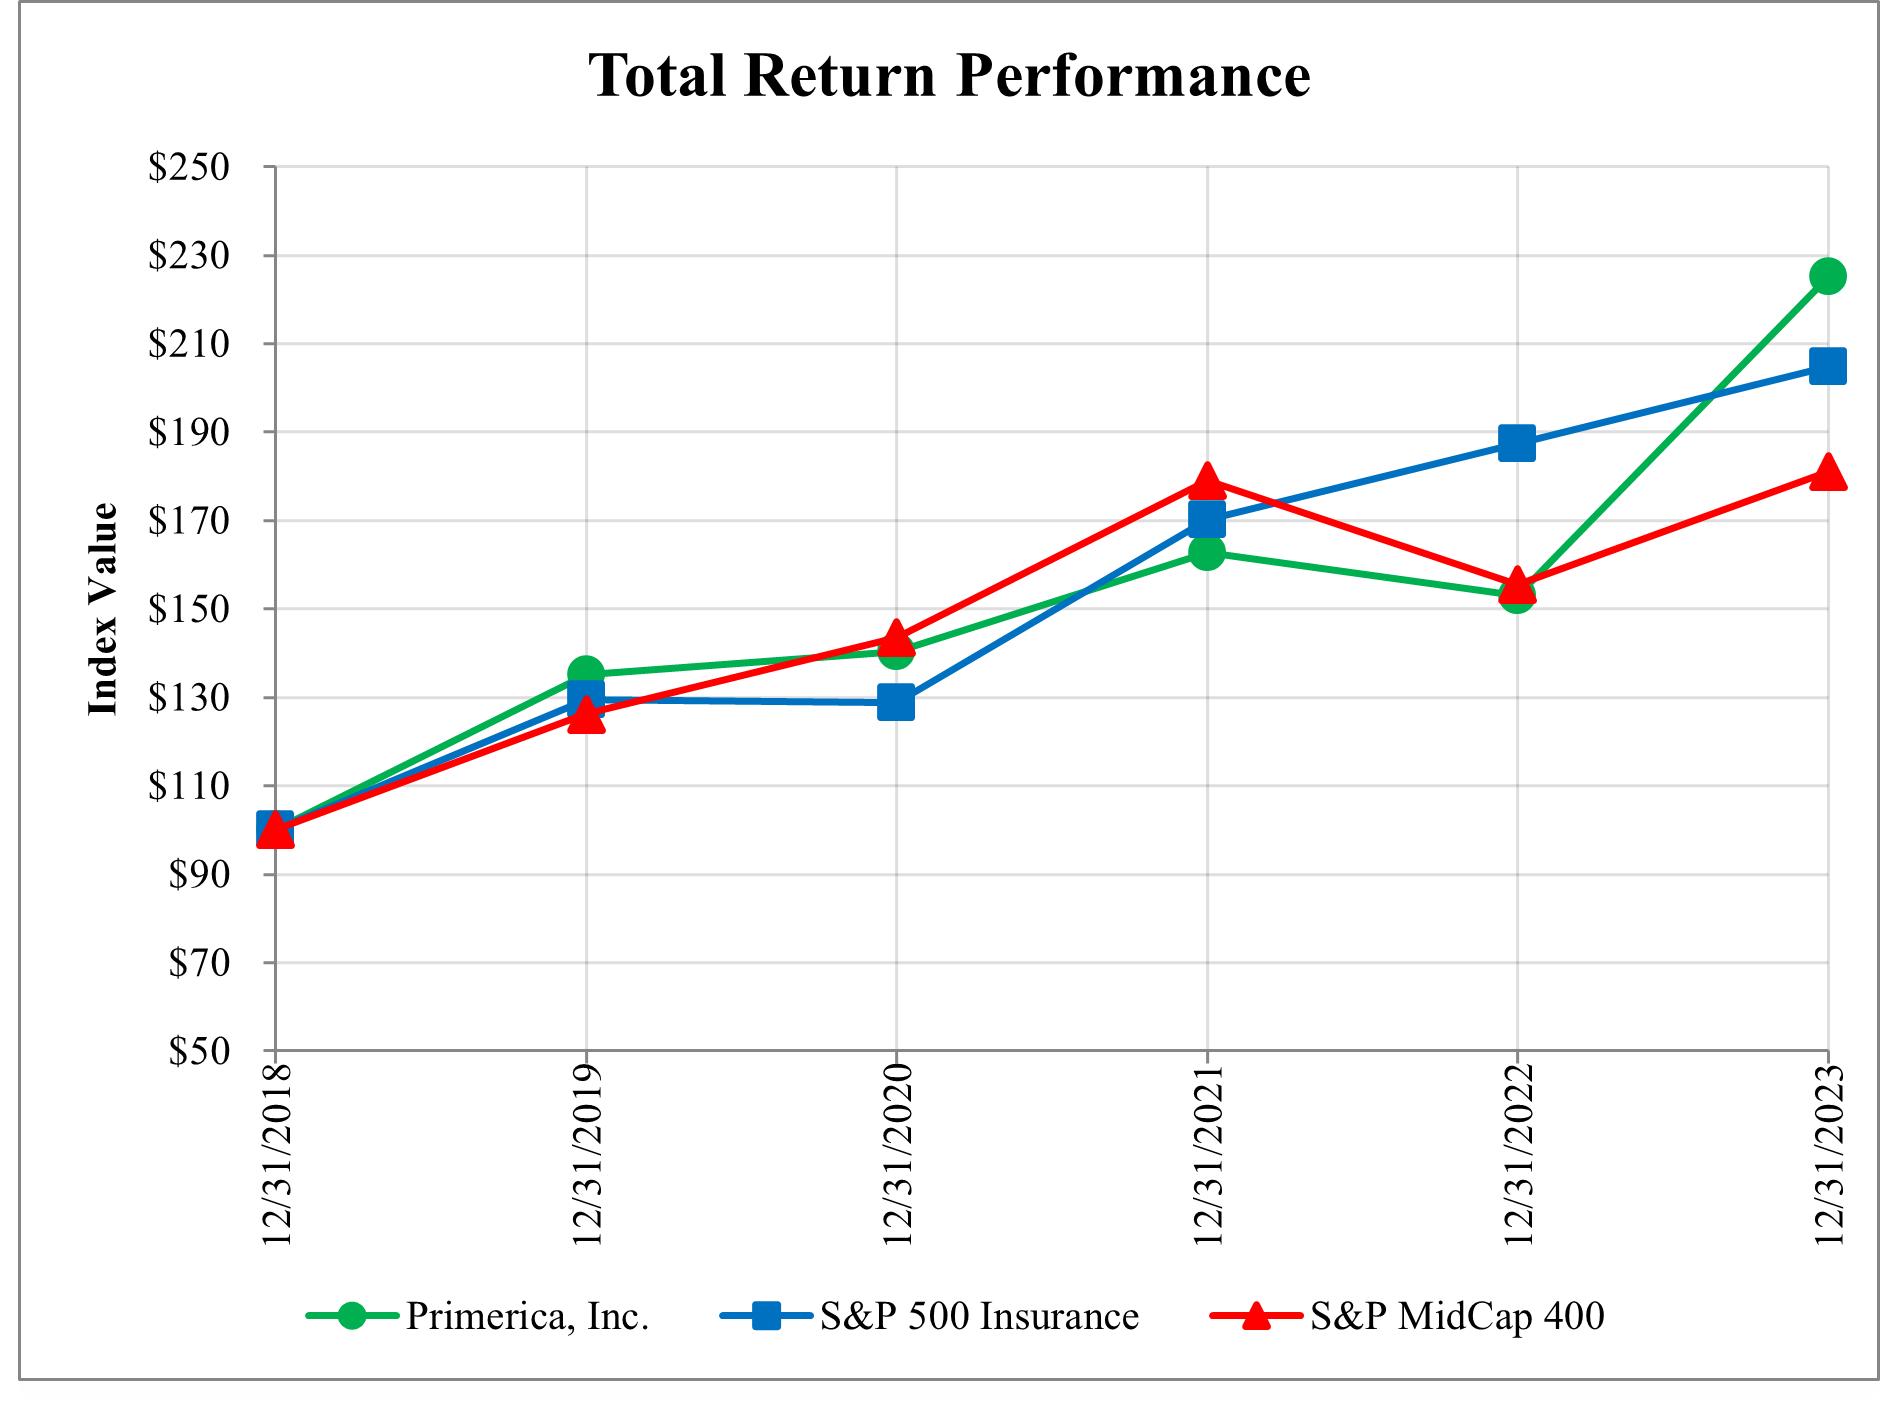
|
|
Period Ended |
|
||||||||||||||||
Index |
|
12/31/2018 |
|
12/31/2019 |
|
12/31/2020 |
|
12/31/2021 |
|
12/31/2022 |
|
12/31/2023 |
|
||||||
Primerica, Inc. |
|
$ |
100.00 |
|
$ |
135.10 |
|
$ |
140.38 |
|
$ |
162.66 |
|
$ |
153.02 |
|
$ |
225.06 |
|
S&P 500 Insurance |
|
|
100.00 |
|
|
129.38 |
|
|
128.81 |
|
|
170.18 |
|
|
187.42 |
|
|
204.78 |
|
S&P MidCap 400 |
|
|
100.00 |
|
|
126.20 |
|
|
143.44 |
|
|
178.95 |
|
|
155.58 |
|
|
181.16 |
|
ITEM 6. [RESERVED]
Not applicable.
48
ITEM 7. MANAGEMENT’S DISCUSSION AND ANALYSIS OF FINANCIAL CONDITION AND RESULTS OF OPERATIONS.
Management’s Discussion and Analysis of Financial Condition and Results of Operations (“MD&A”) is intended to inform the reader about matters affecting the financial condition and results of operations of Primerica, Inc. (the “Parent Company”) and its subsidiaries (collectively, “we”, “us” or the “Company”) for the three-year period ended December 31, 2023. As a result, the following discussion should be read in conjunction with the consolidated financial statements and accompanying notes that are included herein. This discussion contains forward-looking statements that constitute our plans, estimates and beliefs. These forward-looking statements involve numerous risks and uncertainties, including, but not limited to, those discussed in “Item 1A. Risk Factors”. Actual results may differ materially from those contained in any forward-looking statements.
This MD&A is divided into the following sections:
The Company adopted Accounting Standards Update No. 2018-12, Financial Services –Insurance (Topic 944)—Targeted Improvements to the Accounting for Long-Duration Contracts (“LDTI”) on January 1, 2023. The amendments in LDTI changed accounting guidance for insurance companies that issue long-duration contracts, such as term life insurance and segregated funds products. All prior period financial information has been restated as of January 1, 2021 (the “Transition Date”). See Note 1 (Description of Business, Basis of Presentation, and Summary of Significant Accounting Policies) to our consolidated financial statements included elsewhere in this report for more information about the adoption of LDTI.
Business Trends and Conditions
The relative strength and stability of financial markets and economies in the United States and Canada affect our growth and profitability. Our business is, and we expect will continue to be, influenced by a number of industry-wide and product-specific trends and conditions. Economic conditions, including unemployment levels and consumer confidence, influence investment and spending decisions by middle-income consumers, who are generally our primary clients. These conditions and factors also impact prospective recruits’ perceptions of the business opportunity that becoming an independent sales representative offers, which can drive or dampen recruiting. Consumer spending and borrowing levels affect how consumers evaluate their savings and debt management plans. In addition, interest rates and equity market returns impact consumer demand for the savings and investment products we distribute. Our customers’ perception of the strength of the capital markets may also influence their decisions to invest in the investment and savings products we distribute.
The financial and distribution results of our operations in Canada, as reported in U.S. dollars, are affected by changes in the currency exchange rate. As a result, changes in the Canadian dollar exchange rate may significantly affect the result of our business for all amounts translated and reported in U.S. dollars.
Significant volatility in capital markets in recent periods has continued to impact our business. Volatility in capital markets influenced product sales and client asset values that drive revenue in the Investment and Savings Products segment. In addition, the sharp rise in market interest rates during 2022 and further rate increases in 2023 have driven unrealized losses in our investment portfolio, although a sharp decline in market rates during the fourth quarter of 2023 reduced our unrealized losses. We have not recognized losses caused by interest rate volatility in the income statement as we have the ability to hold these investments until maturity or a market price recovery, and we have no present intention to dispose of them. Increased interest rates have also led to increases in net investment income as we are able to earn higher returns on our new debt securities purchases and cash balances.
Inflation remained elevated from historical levels during 2023, although to a lesser extent than 2022 and 2021, which led to an increased cost of living for middle-income families. Continued elevated cost of living could impact demand for our products.
Certain year-over-year comparisons are impacted by the effects of the COVID-19 pandemic (“COVID-19”). Results during 2021 and the first quarter of 2022 reflected the continued impact of COVID-19, namely strong policyholder persistency and elevated claims activity in our Term Life Insurance segment. The elevated impacts of COVID-19 on our results tapered off subsequent to the first quarter of 2022.
The effects of these trends and conditions are discussed below, in the Results of Operations section and in the Financial Condition section.
Size of the Independent Sales Force. Our ability to increase the size of the independent sales force (“independent sales representatives” or “independent sales force”) is largely based on the success of the independent sales force’s recruiting efforts as well as training and motivating recruits to get licensed to sell life insurance. We believe that recruitment and licensing levels are important
49
to independent sales force trends, and growth in recruiting and licensing is usually indicative of future growth in the overall size of the independent sales force. Recruiting changes do not always result in commensurate changes in the size of the licensed independent sales force because new recruits may obtain the requisite licenses at rates above or below historical levels.
Details on recruiting and life-licensed independent sales representative activity were as follows:
|
|
Year ended December 31, |
|
|||||||||
|
|
2023 |
|
|
2022 |
|
|
2021 |
|
|||
New recruits |
|
|
361,925 |
|
|
|
359,735 |
|
|
|
349,374 |
|
New life-licensed independent sales representatives |
|
|
49,096 |
|
|
|
45,147 |
|
|
|
39,622 |
|
Life-licensed independent sales representatives, at period end |
|
|
141,572 |
|
|
|
135,208 |
|
|
|
129,515 |
|
The number of new recruits increased in 2023 compared to 2022. Recruiting activity was strong in 2023 without the benefit of significant recruiting incentives as the Company continues to see a high degree of interest from people who are attracted to the business opportunity. The number of new recruits increased in 2022 compared to 2021 primarily due to strong recruiting efforts and the offering of special recruiting incentives following our biennial convention held in June 2022. Approximately 83,000 individuals were recruited while the special incentives were in place. Various recruiting incentives in both 2022 and 2021 also positively impacted recruiting results during each year.
New life-licensed independent sales representatives increased in 2023 compared to 2022 primarily due to strong life-licensing momentum experienced throughout 2023. The strong life-licensing activity realized in 2023 was primarily driven by the heightened emphasis placed by the Company and independent sales force leaders on licensing and the continued benefits of improvements to the licensing process, which include new licensing progress-tracking tools and an increased number of in-person licensing classes. New life-licensed independent sales representatives increased in 2022 compared to 2021 primarily due to the elevated recruiting volume discussed above combined with licensing process improvements throughout 2022 such as the restoration of in-person licensing classes.
The number of life-licensed independent sales representatives increased during both 2023 and 2022, reflecting strong recruiting and improvements to the licensing process as discussed above.
Term Life Insurance Product Sales and Face Amount In Force. The average number of life-licensed independent sales representatives and the number of term life insurance policies issued, as well as the average monthly rate of new policies issued per life-licensed independent sales representative (historically between 0.20 and 0.24, as adjusted (1)), were as follows:
|
|
Year ended December 31, |
|
|||||||||
|
|
2023 |
|
|
2022 |
|
|
Adjusted 2022 |
|
|||
Average number of life-licensed independent sales representatives |
|
|
137,760 |
|
|
|
132,077 |
|
|
|
132,077 |
|
Number of new policies issued(1) |
|
|
358,860 |
|
|
|
291,918 |
|
|
|
333,020 |
|
Average monthly rate of new policies issued per life-licensed(1) |
|
|
0.22 |
|
|
|
0.18 |
|
|
|
0.21 |
|
The average number of life-licensed independent sales representatives increased during both 2023 and 2022 from 131,315 at December 31, 2021 as a result of strong recruiting and improvements to the licensing process as discussed above.
New policies issued during 2023 increased compared to adjusted 2022 as a result of continued growth in the number of life-licensed independent sales representatives and the customer appeal of our new term life insurance products that were introduced in late 2022.
Productivity in 2023 and adjusted 2022, measured by the average monthly rate of new policies issued per life-licensed independent sales representative, was in line with our adjusted historical range.
New policy issuance metrics for 2021 are not comparable to the information shown for 2023 and adjusted 2022 due to the change in how policies are structured in relation to individual lives as described in the footnote to the table above. The discussion of new policy issuance comparisons between 2022 and 2021 under our legacy policy structure can be found in "Management’s Discussion and Analysis of Financial Condition and Results of Operations" in Part II, Item 7 of the Company’s Annual Report on Form 10-K for the fiscal year ended December 31, 2022 (the “2022 MD&A”).
50
The changes in the face amount of our in-force book of term life insurance policies were as follows:
|
|
Year ended December 31, |
|||||||||||||||||||||||
|
|
2023 |
|
|
% of beginning balance |
|
|
2022 |
|
|
% of beginning balance |
|
|
2021 |
|
|
% of beginning balance |
|
|
||||||
|
(Dollars in millions) |
||||||||||||||||||||||||
Face amount in-force, beginning of period |
|
$ |
916,808 |
|
|
|
|
|
$ |
903,403 |
|
|
|
|
|
$ |
858,818 |
|
|
|
|
|
|||
Net change in face amount: |
|
|
|
|
|
|
|
|
|
|
|
|
|
|
|
|
|
|
|
||||||
Issued face amount |
|
|
119,102 |
|
|
|
13 |
% |
|
|
103,822 |
|
|
|
11 |
% |
|
|
108,521 |
|
|
|
13 |
% |
|
Terminations |
|
|
(94,230 |
) |
|
|
(10 |
)% |
|
|
(82,894 |
) |
|
|
(9 |
)% |
|
|
(64,798 |
) |
|
|
(8 |
)% |
|
Foreign currency |
|
|
2,929 |
|
|
* |
|
|
|
(7,523 |
) |
|
* |
|
|
|
862 |
|
|
* |
|
|
|||
Net change in face amount |
|
|
27,801 |
|
|
|
3 |
% |
|
|
13,405 |
|
|
|
1 |
% |
|
|
44,585 |
|
|
|
5 |
% |
|
Face amount in-force, end of period |
|
$ |
944,609 |
|
|
|
|
|
$ |
916,808 |
|
|
|
|
|
$ |
903,403 |
|
|
|
|
|
|||
* Less than 1%.
The face amount of term life policies in-force increased from December 31, 2022 to December 31, 2023 as the face amount issued continued to exceed the face amount terminated. Issued face amount during 2023 increased from 2022 due to an increase in both the number of new policies issued and higher average face amounts per life insured. Policy terminations were elevated across many policy durations during 2023 with the higher cost of living likely a key contributing factor. The early part of 2022 was the last period that reflected the benefit of the higher persistency experienced during the height of the COVID-19 pandemic. The face amount of term life policies in-force increased from December 31, 2021 to December 31, 2022 as the face amount issued continued to exceed the face amount terminated. The increase was partially offset by movement in the foreign exchange rate as the U.S. dollar strengthened in relation to the Canadian dollar, which negatively impacted the translated face amount in force as of December 31, 2022. Issued face amount during 2022 decreased versus 2021 due to a decrease in new policies issued partially offset by higher average issued face amounts. New policies issued decreased and policy terminations increased in 2022 versus 2021 as new policy demand and persistency normalized toward pre-COVID-19 pandemic levels.
Our average issued face amount per new policy increased to approximately $256,100 in 2023 compared to $228,000 in 2022, using the adjusted 2022 number of new policies issued as discussed above. The average issued face amount per new policy was higher in 2023 compared with adjusted 2022 due to the launch of our new term life insurance products, which drove an increase in demand for policies at higher face amount levels. For discussion of average issued face amount per new policy between 2022 and 2021 under our legacy policy structure, refer to the 2022 MD&A.
Investment and Savings Product Sales, Asset Values and Accounts/Positions. Investment and savings product sales were as follows:
|
|
Year ended December 31, |
|
|
2023 vs. 2022 change |
|
|
2022 vs. 2021 change |
|
|||||||||||||||||||
|
|
2023 |
|
|
2022 |
|
|
2021 |
|
|
$ |
|
|
% |
|
|
$ |
|
|
% |
|
|||||||
|
(Dollars in millions) |
|
||||||||||||||||||||||||||
Product sales: |
|
|
|
|
|
|
|
|
|
|
|
|
|
|
|
|
|
|
|
|
|
|||||||
U.S. retail mutual funds |
|
$ |
3,898 |
|
|
$ |
4,266 |
|
|
$ |
5,146 |
|
|
$ |
(368 |
) |
|
|
(9 |
)% |
|
$ |
(880 |
) |
|
|
(17 |
)% |
Canada retail mutual funds - with up-front sales commissions |
|
|
478 |
|
|
|
912 |
|
|
|
1,439 |
|
|
$ |
(434 |
) |
|
|
(48 |
)% |
|
$ |
(527 |
) |
|
|
(37 |
)% |
Annuities and other |
|
|
2,818 |
|
|
|
2,629 |
|
|
|
3,076 |
|
|
|
189 |
|
|
|
7 |
% |
|
|
(447 |
) |
|
|
(15 |
)% |
Total sales-based revenue generating product sales |
|
|
7,194 |
|
|
|
7,807 |
|
|
|
9,661 |
|
|
|
(613 |
) |
|
|
(8 |
)% |
|
|
(1,854 |
) |
|
|
(19 |
)% |
Managed investments |
|
|
1,212 |
|
|
|
1,513 |
|
|
|
1,506 |
|
|
|
(301 |
) |
|
|
(20 |
)% |
|
|
7 |
|
|
* |
|
|
Canada retail mutual funds - no up-front sales commissions |
|
|
691 |
|
|
|
494 |
|
|
|
318 |
|
|
|
197 |
|
|
|
40 |
% |
|
|
176 |
|
|
|
55 |
% |
Segregated funds |
|
|
115 |
|
|
|
195 |
|
|
|
219 |
|
|
|
(80 |
) |
|
|
(41 |
)% |
|
|
(24 |
) |
|
|
(11 |
)% |
Total product sales |
|
$ |
9,212 |
|
|
$ |
10,009 |
|
|
$ |
11,704 |
|
|
$ |
(797 |
) |
|
|
(8 |
)% |
|
$ |
(1,695 |
) |
|
|
(14 |
)% |
* Less than 1%.
51
The rollforward of asset values in client accounts was as follows:
|
|
Year ended December 31, |
|||||||||||||||||||||||||
|
|
2023 |
|
|
% of beginning balance |
|
2022 |
|
|
% of beginning balance |
|
2021 |
|
|
% of beginning balance |
||||||||||||
|
|
(Dollars in millions) |
|||||||||||||||||||||||||
Asset values, beginning of period |
|
$ |
83,949 |
|
|
|
|
|
|
$ |
97,312 |
|
|
|
|
|
|
$ |
81,533 |
|
|
|
|
|
|||
Net change in asset values: |
|
|
|
|
|
|
|
|
|
|
|
|
|
|
|
|
|
|
|
|
|
||||||
Inflows |
|
|
9,212 |
|
|
|
11 |
% |
|
|
|
10,009 |
|
|
|
10 |
% |
|
|
|
11,704 |
|
|
|
14 |
% |
|
Redemptions |
|
|
(7,663 |
) |
|
|
(9 |
)% |
|
|
|
(6,587 |
) |
|
|
(7 |
)% |
|
|
|
(7,162 |
) |
|
|
(9 |
)% |
|
Net flows |
|
|
1,549 |
|
|
|
2 |
% |
|
|
|
3,422 |
|
|
|
4 |
% |
|
|
|
4,542 |
|
|
|
6 |
% |
|
Change in fair value, net |
|
|
10,865 |
|
|
|
13 |
% |
|
|
|
(15,855 |
) |
|
|
(16 |
)% |
|
|
|
11,146 |
|
|
|
14 |
% |
|
Foreign currency, net |
|
|
372 |
|
|
* |
|
|
|
|
(930 |
) |
|
* |
|
|
|
|
91 |
|
|
* |
|
|
|||
Net change in asset values |
|
|
12,786 |
|
|
|
15 |
% |
|
|
|
(13,363 |
) |
|
|
(14 |
)% |
|
|
|
15,779 |
|
|
|
19 |
% |
|
Asset values, end of period |
|
$ |
96,735 |
|
|
|
|
|
|
$ |
83,949 |
|
|
|
|
|
|
$ |
97,312 |
|
|
|
|
|
|||
* Less than 1%.
Average client asset values were as follows:
|
|
Year ended December 31, |
|
|
2023 vs. 2022 change |
|
|
2022 vs. 2021 change |
|
|||||||||||||||||||
|
|
2023 |
|
|
2022 |
|
|
2021 |
|
|
$ |
|
|
% |
|
|
$ |
|
|
% |
|
|||||||
|
(Dollars in millions) |
|
||||||||||||||||||||||||||
Average client asset values: |
|
|
|
|
|
|
|
|
|
|
|
|
|
|
|
|
|
|
|
|
|
|||||||
Retail mutual funds |
|
$ |
55,286 |
|
|
$ |
53,822 |
|
|
$ |
55,997 |
|
|
$ |
1,464 |
|
|
|
3 |
% |
|
$ |
(2,175 |
) |
|
|
(4 |
)% |
Annuities and other |
|
|
24,229 |
|
|
|
23,947 |
|
|
|
25,211 |
|
|
|
282 |
|
|
|
1 |
% |
|
|
(1,264 |
) |
|
|
(5 |
)% |
Managed investments |
|
|
7,663 |
|
|
|
6,951 |
|
|
|
6,086 |
|
|
|
712 |
|
|
|
10 |
% |
|
|
865 |
|
|
|
14 |
% |
Segregated funds |
|
|
2,295 |
|
|
|
2,474 |
|
|
|
2,698 |
|
|
|
(179 |
) |
|
|
(7 |
)% |
|
|
(224 |
) |
|
|
(8 |
)% |
Total average client asset values |
|
$ |
89,473 |
|
|
$ |
87,194 |
|
|
$ |
89,992 |
|
|
$ |
2,279 |
|
|
|
3 |
% |
|
$ |
(2,798 |
) |
|
|
(3 |
)% |
Average number of fee-generating positions was as follows:
|
|
Year ended December 31, |
|
|
2023 vs. 2022 change |
|
|
2022 vs. 2021 change |
|
|||||||||||||||||||
|
|
2023 |
|
|
2022 |
|
|
2021 |
|
|
Positions |
|
|
% |
|
|
Positions |
|
|
% |
|
|||||||
|
(Positions in thousands) |
|
||||||||||||||||||||||||||
Average number of fee-generating |
|
|
|
|
|
|
|
|
|
|
|
|
|
|
|
|
|
|
|
|
|
|||||||
Recordkeeping and custodial |
|
|
2,335 |
|
|
|
2,281 |
|
|
|
2,171 |
|
|
|
54 |
|
|
|
2 |
% |
|
|
110 |
|
|
|
5 |
% |
Recordkeeping only |
|
|
836 |
|
|
|
814 |
|
|
|
749 |
|
|
|
22 |
|
|
|
3 |
% |
|
|
65 |
|
|
|
9 |
% |
Total average number of fee- |
|
|
3,171 |
|
|
|
3,095 |
|
|
|
2,920 |
|
|
|
76 |
|
|
|
2 |
% |
|
|
175 |
|
|
|
6 |
% |
Product sales. Investment and savings product sales decreased in 2023 from 2022, resulting primarily from lower year-over-year product sales during the first half of 2023. The impact of market volatility, the higher cost of living, and the availability of high yield money market and savings account alternatives likely drove the reduction in demand for U.S. mutual funds, total Canadian mutual funds and managed accounts during the first half of 2023. By comparison, product sales in the early part of 2022 reflected strong demand that followed positive equity market returns. The majority of Canadian mutual fund product sales shifted to a no up-front sales commission model in 2023 compared to an up-front sales commission model in the first part of 2022 as a result of the introduction of our new principal distributor Canadian mutual fund product in July 2022. The principal distributor model results in higher asset-based trail commission revenues over time in lieu of up-front compensation at the time of sale. Additionally, Canadian segregated funds product sales decreased in 2023 versus 2022 due to regulatory restrictions on fees charged for these products that went into effect in Canada. Refer to “Regulatory Changes” below for additional information regarding restrictions on segregated funds compensation models in Canada. Partially offsetting these decreases were higher sales of variable annuities in 2023 as investor demand for the guarantee features these products offer increased likely due to recent market volatility.
The decrease in investment and savings product sales in 2022 from 2021 was led by lower sales of retail mutual funds and variable annuities as investor demand during 2022 deteriorated in response to negative market conditions. Demand for investment and savings products was robust in 2021 due in large part to positive equity market conditions. The reversal of the positive equity market conditions in 2022 led to the year-over-year decline in product sales. Also contributing to the decline in product sales from 2021 to 2022 was the transition to the new principal distributor Canadian mutual fund product in July 2022 as described above.
52
Rollforward of client asset values. Ending client asset values increased in 2023 from 2022 primarily due to the difference in market performance during each respective period. Net flows remained positive during 2023 but were lower than net flows in 2022. Ending client asset values decreased in 2022 from 2021 primarily due to negative market performance in 2022. Also contributing to the decrease was movement in the foreign exchange rate as the U.S. dollar strengthened in relation to the Canadian dollar, which negatively impacted client asset values as of December 31, 2022. Net flows remained positive for 2022, albeit to a lesser extent than in 2021.
Average client asset values. Average client asset values increased modestly in 2023 compared to 2022. The increase was driven by the timing and changes in market conditions that affected the balance of client assets during each year combined with the impact of positive net flows. Average client asset values decreased modestly in 2022 compared to 2021 primarily due to the timing of negative equity market performance during 2022 partially offset by the impact of positive net flows.
Average number of fee-generating positions. The average number of fee-generating positions increased in 2023 compared to 2022 and in 2022 compared to 2021 primarily due to the continued cumulative effect of retail mutual fund sales in recent periods. This led to an increase in the number of retail mutual fund positions serviced on our transfer agent recordkeeping platform.
Senior Health Key Performance Indicators.
Submitted Policies and Approved Policies
Submitted policies. Submitted policies represent the number of completed applications that the applicant has authorized e-TeleQuote Insurance, Inc. (“e-TeleQuote”) to submit to the health insurance carrier. The applicant may need to take additional action, including providing subsequent information, before the application is reviewed by the health insurance carrier.
Approved policies. Approved policies represent an estimate of submitted policies approved by the health insurance carriers for the identified product during the indicated period. Not all approved policies will go in force. In general, the relationship between submitted policies and approved policies has been seasonally consistent. Therefore, factors impacting the number of submitted policies generally impact the number of approved policies.
The number of Senior Health submitted policies and approved policies were as follows:
|
|
Year ended December 31, |
|
|||||||||
|
|
2023 |
|
|
2022 |
|
|
2021(1) |
|
|||
Number of Senior Health submitted policies |
|
|
63,092 |
|
|
|
85,038 |
|
|
|
60,009 |
|
Number of Senior Health approved policies |
|
|
58,457 |
|
|
|
77,086 |
|
|
|
50,323 |
|
(1) From the acquisition date of July 1, 2021.
The Senior Health segment experiences notable seasonality with the strongest demand occurring in the fourth quarter due to the Medicare Annual Election Period (“AEP”) from October 15th to December 7th. We also experience seasonally higher demand in the first quarter due to the Medicare Open Enrollment Period (“OEP”) from January 1st to March 31st, which allows individuals to switch Medicare Advantage plans. Meanwhile, the second and third quarters experience seasonally lower demand as the focus for submitted policies is limited to beneficiaries that are dual eligible (Medicare and Medicaid), qualify for a special enrollment period, recently aged into Medicare or are enrolling off of an employer-sponsored plan, and other less common situations.
The number of submitted and approved policies decreased in 2023 compared to 2022 primarily due to the Company’s efforts to temper growth in favor of developing more efficient lead procurement and conversion, a decline in the number of tenured e-TeleQuote licensed health insurance agents and an increase in newly-hired licensed health insurance agents that resulted in lower productivity. The number of submitted and approved policies in 2022 compared to 2021 is primarily impacted by the timing of the acquisition of e-TeleQuote on July 1, 2021. A full year of submitted and approved policies are included in 2022 compared to only six months for 2021. The number of submitted and approved policies in 2022 also reflects the Company’s efforts to scale back growth and limit the number of agents in favor of developing more efficient lead procurement.
Senior Health Policies Sourced by Primerica Independent Sales Representatives
Primerica independent sales representatives are certified by Primerica to refer eligible Medicare beneficiaries to e-TeleQuote licensed health insurance agents for potential enrollment in policies distributed by e-TeleQuote after completion of a brief certification course offered by Primerica.
The number of submitted policies sourced by Primerica independent sales representatives measures the number of Senior Health policies submitted by e-TeleQuote to its third-party health insurance carriers that originated through the Primerica independent sales force.
53
|
|
Year ended December 31, |
|
|||||||||
|
|
2023 |
|
|
2022 |
|
|
2021(1) |
|
|||
Submitted policies sourced by Primerica independent sales representatives |
|
|
10,440 |
|
|
|
8,501 |
|
|
|
4,494 |
|
(1) From the acquisition date of July 1, 2021.
The number of submitted policies sourced by Primerica independent sales representatives increased in 2023 compared to 2022 primarily due to increasing experience with the Primerica referral program. The number of submitted policies sourced by Primerica independent sales representatives during 2022 increased compared to 2021 primarily due to the timing of our acquisition of e-TeleQuote on July 1, 2021. A full year of submitted policies sourced by Primerica independent sales representatives are included during 2022 compared to only six months for 2021.
Lifetime Value of Commissions and Contract Acquisition Costs
Lifetime value of commissions (“LTV”). LTV represents the cumulative total of commissions and administrative fees estimated to be collected over the expected life of a policy for policies approved during the period. For more information on LTV, refer to Note 19 (Revenue from Contracts with Customers) of our consolidated financial statements included elsewhere in this report and the Factors Affecting our Results – Senior Health Segment section.
Contract acquisition costs (“CAC”). CAC represents the total direct costs incurred to acquire approved policies. CAC are primarily comprised of the costs associated with generating or acquiring leads, including fees paid to Primerica Senior Health certified independent sales representatives, as well as compensation, licensing, and training costs associated with our team of e-TeleQuote licensed health insurance agents in addition to per policy technology costs. The number of e-TeleQuote licensed health insurance agents, agent tenure, attrition rate and productivity all impact CAC. Other than costs incurred to assist beneficiaries who are switching plans with the same carrier, we incur the entire cost of approved policies prior to enrollment and prior to receiving our first commission-related payment.
Per policy metrics for LTV and CAC measure our ability to profitably distribute Senior Health insurance products.
The LTV per approved policy, CAC per approved policy, and ratio of LTV to CAC per approved policy were as follows:
|
|
Year ended December 31, |
|
|||||||||
|
|
2023 |
|
|
2022 |
|
|
2021(1) |
|
|||
LTV per policy approved during the period |
|
$ |
945 |
|
|
$ |
860 |
|
|
$ |
1,109 |
|
CAC per policy approved during the period |
|
$ |
945 |
|
|
$ |
888 |
|
|
$ |
1,049 |
|
LTV/CAC per approved policy |
|
|
1.00 |
|
|
|
0.97 |
|
|
|
1.10 |
|
(1) From the acquisition date of July 1, 2021.
LTV per approved policy reflects current estimates for renewal rates, policy retention and chargeback activity taking into consideration the most recent experience through December 31, 2023. LTV per approved policy increased during 2023 compared to 2022 primarily due to the inclusion of the majority of marketing development revenue in LTV beginning in the fourth quarter of 2023 due to changes in carrier contracts. Prior to the fourth quarter of 2023, all marketing development revenue received from carriers was recognized in Other, net revenue. Also contributing to the higher LTV in 2023 versus 2022 were higher commission rates from annual rate increases and stabilizing policy churn. The Company saw lower renewal retention rates during 2022 compared to historical experience due to an increased number of consumers who changed plans and increased plan offerings by carriers. This dynamic led to the lower LTV estimated per approved policy in 2022 compared to 2021.
CAC per approved policy increased in 2023 compared to 2022 primarily due to the impact from a lower mix of tenured e-TeleQuote licensed health insurance agents. During 2023, e-TeleQuote experienced higher agent attrition while it planned for an increase in its agent base, which led to increased costs to hire, train and license new agents in preparation for AEP and OEP. In addition, lower tenured agents do not convert leads to approved policies as efficiently as more tenured agents, contributing to higher CAC per approved policy. Comparing 2022 to 2021, the reduction in CAC per approved policy reflects a number of factors including a higher ratio of tenured agents, revised lead acquisition strategies, improved lead routing, and enhancements in agent training.
Regulatory Changes.
Worker classification standards. In the U.S., the Department of Labor (“DOL”) issued a final rule interpreting the “economic realities” worker classification standard applicable to the Fair Labor Standards Act. The DOL’s interpretation generally aligns with legal precedent, relying on an analysis of six typical factors indicating worker status and taking into account the “totality of the circumstances”. Other federal and state legislative and regulatory proposals regarding worker classification have also come under consideration. It is difficult to predict what the outcome of worker classification activity may be. Changes to worker classification laws could impact our business as sales representatives (other than those hired by e-TeleQuote) are independent contractors.
54
Fiduciary standards for investment recommendations. In October 2023, the DOL proposed a fiduciary rule package (“DOL Fiduciary Proposal”) that would revise the fiduciary definition and amend certain prohibited transaction exemptions relied on by fiduciaries subject to the Employee Retirement Income Security Act of 1974 for the receipt of compensation. In response to prior rulemakings and guidance, our business already utilizes the DOL’s prohibited transaction exemption established in 2020 for fiduciary recommendations. As a proposed rulemaking package, the DOL Fiduciary Proposal is subject to public comments and challenges. While its final outcome is uncertain, we anticipate that if the DOL Fiduciary Proposal were finalized as proposed then we would not have to make substantial adjustments to our Investment and Savings Products business operations.
Restrictions on compensation models in Canada. The organization of provincial and territorial securities commissions throughout Canada (collectively referred to as the Canadian Securities Administrators (“CSA”)) implemented rule amendments that prohibit up-front sales commissions by fund companies for the sale of mutual funds offered under a prospectus in Canada (“DSC Ban”), effective June 1, 2022. During 2022, in response to regulatory changes in Canada, we developed a set of mutual fund products with two third-party mutual fund companies that are sold exclusively by our independent sales representatives (the “Principal Distributor funds”). The revenue we receive is primarily in the form of asset-based distribution fees from the mutual fund companies and asset-based service fees that are charged to investors. In turn, the primary compensation we offer independent sales representatives is the option of an up-front sales commission or higher asset-based commissions over time. Although we received the requisite approval, the CSA has indicated that it intends to closely examine the model, including potentially through a public consultation on sales practices, and may require undertakings or consider future amendments that would require modifications to the model, including with respect to its up-front commission features. At this time, we cannot quantify the financial impact, if any, of future changes to our business that may be necessary if our Principal Distributor funds model is required to be modified or discontinued. During the year ended December 31, 2023, Canadian mutual funds represented approximately 13% of our total investment and savings product sales and approximately 13% of our average client asset values.
As mandated by insurance regulators in Canada, a cessation of deferred sales charges on new segregated fund contracts entered into after May 31, 2023 went into effect as previously announced. Deferred sales charges will continue to be allowed on subsequent deposits to existing segregated funds contracts for a period of time; however, insurance regulators will be further evaluating whether to allow this continued use. Our Canadian segregated funds products were primarily sold on a deferred sales charge basis and we paid up-front commissions to the independent sales representatives for the sale of these products. As we anticipated, we experienced a decline in segregated funds product sales beginning in June 2023. Without further clarity from regulators on allowable segregated funds compensation practices, we are unable to evaluate and introduce new compensation practices for the sale of our segregated funds or similar products we could potentially distribute on behalf of third parties. We earn revenue from Canadian segregated funds products based on a percentage of client assets under management. During the year ended December 31, 2023, Canadian segregated funds represented approximately 1% of our total investment and savings product sales and approximately 3% of our average client asset values.
Factors Affecting Our Results
Refer to the Business Trends and Conditions section for discussion of the potential impact on our business from COVID-19.
Term Life Insurance Segment. The Term Life Insurance segment results are primarily driven by sales volumes, how closely actual experience matches our pricing assumptions, terms and use of reinsurance, and expenses.
Sales and policies in-force. Sales of term policies and the size and characteristics of our in-force book of policies are vital to our results over the long term. Premium revenue is recognized as it is earned over the term of the policy. However, because we incur significant cash outflows at or about the time policies are issued, including the payment of sales commissions and underwriting costs, changes in life insurance sales volume in a period will have a more immediate impact on our cash flows than on revenue.
Historically, we have found that while sales volume of term life insurance products between fiscal periods may vary based on a variety of factors, the productivity of sales representatives generally remains within a range (i.e., an average monthly rate of new policies issued per life-licensed independent sales representative between 0.20 and 0.24, as adjusted). The volume of term life insurance products sales will fluctuate in the short term, but over the longer term, our sales volume generally correlates to the size of the independent sales force.
Actuarial assumptions. The actuarial assumptions that underlie our reserves are based upon our best estimates of mortality, persistency, and disability. Our results will be affected to the extent there is a variance between our actuarial assumptions and actual experience. These variances will be reflected in our financial results by unlocking assumptions and cash flows underlying the liability for future policy benefits (“LFPB”) and ceded reserves that are part of the reinsurance recoverables. See Note 10 (Future Policy Benefits) for more information on LFPB. The variances are also reflected in the projection of future face amount that is the basis for amortizing deferred policy acquisition costs (“DAC”).
55
Reinsurance. We use reinsurance extensively, which has a significant effect on our results of operations. We have generally reinsured between 80% and 90% of the mortality risk on term life insurance (excluding coverage under certain riders) on a quota share YRT basis. To the extent actual mortality experience is more or less favorable than the contractual rate, the reinsurer will earn incremental profits or bear the incremental cost, as applicable. In contrast to coinsurance, which is intended to eliminate all risks (other than counterparty risk of the reinsurer) and rewards associated with a specified percentage of the block of policies subject to the reinsurance arrangement, the YRT reinsurance arrangements we enter into are intended only to reduce volatility associated with variances between estimated and actual mortality rates.
In 2010, as part of our corporate reorganization and the initial public offering of our common stock, we entered into significant coinsurance transactions (the “IPO coinsurance transactions”) with entities then affiliated with Citigroup, Inc. (collectively, the “IPO coinsurers”) and ceded between 80% and 90% of the risks and rewards of term life insurance policies that were in-force at year-end 2009. We administer all such policies subject to these coinsurance agreements. Policies reaching the end of their initial level term period are no longer ceded under the IPO coinsurance transactions.
The effect of our reinsurance arrangements on ceded premiums and benefits and expenses on our statements of income follows:
We may alter our reinsurance practices at any time due to the unavailability of YRT reinsurance at attractive rates or the availability of alternatives to reduce our risk exposure. We intend to continue ceding approximately 90% of our U.S. and Canadian mortality risk on new business.
Expenses. Results are also affected by variances in client acquisition, maintenance and administration expense levels.
Investment and Savings Products Segment. The Investment and Savings Products segment results are primarily driven by sales, the value of assets in client accounts for which we earn ongoing management, marketing and support, and distribution fees, and the number of transfer agent recordkeeping positions and non-bank custodial fee-generating accounts we administer.
Sales. We earn commissions and fees, such as dealer re-allowances and marketing and distribution fees, based on sales of mutual fund products and annuities in the United States and sales of certain mutual fund products in Canada. Sales of investment and savings products are influenced by the overall demand for investment products in the United States and Canada, as well as by the size and productivity of the independent sales force. We generally experience seasonality in the Investment and Savings Products segment results due to our high concentration of sales of retirement account products. These accounts are typically funded in February through April, coincident with our clients’ tax return preparation season. While we believe the size of the independent sales force is a factor in driving sales volume in this segment, there are a number of other variables, such as economic and market conditions, which may have a significantly greater effect on sales volume in any given fiscal period.
Asset values in client accounts. We earn marketing and distribution fees (trail commissions or, with respect to U.S. mutual funds, 12b-1 fees) on mutual fund and annuity assets in the United States and Canada. In the United States, we also earn investment advisory and
56
administrative fees on assets in managed investments. In Canada, we earn marketing, distribution, and shareholder services fees on mutual fund assets for which we serve as the principal distributor and management fees on the segregated funds for which we serve as investment manager. Asset values are influenced by new product sales, ongoing contributions to existing accounts, redemptions and the change in market values in existing accounts. While we offer a wide variety of asset classes and investment styles, our clients’ accounts are primarily invested in equity funds. Volatility in equity markets will impact the value of assets in client accounts and, as a result, the revenue we earn on those assets.
Positions. We earn transfer agent recordkeeping fees for administrative functions we perform on behalf of several of our mutual fund providers. An individual client account may include multiple fund positions for which we earn transfer agent recordkeeping fees. We may also receive fees earned for non-bank custodial services that we provide to clients with retirement plan accounts.
Sales mix. While our investment and savings products all provide similar long-term economic returns to the Company, our results in a given fiscal period will be affected by changes in the overall mix of products within these categories. Examples of changes in the sales mix that influence our results include the following:
Senior Health Segment. The Senior Health segment results are primarily driven by the number of approved policies, LTV per approved policy and tail revenue adjustments, CAC per approved policy, and other revenue.
Approved policies. Approved policies represent an estimate of submitted policies approved by the health insurance carriers for the identified product during the indicated period. Not all approved policies will go in force. In general, the relationship between the number of submitted policies and approved policies has been seasonally consistent. Therefore, factors impacting the number of submitted policies generally impact the number of approved policies. Revenue is primarily generated from approved policies, and LTVs are recorded when the enrollment is approved by the applicable health insurance carrier. Medicare Advantage plans make up nearly all of the approved policies we distribute. The number of approved policies is influenced by the following:
LTV per approved policy and tail revenue adjustments. When a policy is approved by the health insurance carrier, commission revenue is recognized based on an estimated LTV per approved policy. LTV per approved policy is the cumulative total of commissions (including administrative and marketing development payments received on a per approved policy basis) estimated to be collected over the expected life of a policy, subject to constraints applied in accordance with our revenue recognition policy. Specifically, LTV per approved policy is equal to the sum of the initial commissions and payments, less an estimate of chargebacks for paid policies that are disenrolled during the first policy year, plus forecasted renewal commissions. This estimate is driven by several factors including, but not limited to, commission rates from health insurance carriers, expected policy turnover, emerging chargeback activity and applied constraints. These factors may result in varying values from period to period.
We recognize adjustments to revenue outside of LTV for approved policies from prior periods when our cash collections are, or are expected to be, different from the estimated constrained LTVs, which we refer to as tail revenue adjustments. The recognition of tail revenue adjustments results from a change in the estimate of expected cash collections when actual cash collections or communicated rate increases have indicated a trend that is different from the estimated constrained LTV. Tail revenue adjustments can be positive or negative, and we recognize positive adjustments to revenue when we do not believe it is probable that a significant reversal of cumulative revenue will occur.
57
CAC per approved policy. Results are also driven by the costs of acquisition, which is defined as the total direct costs incurred per approved policy. Our costs of acquisition are primarily comprised of the cost to generate and acquire leads, including fees paid to Primerica Senior Health certified independent sales representatives, and the labor, benefits, bonus compensation, licensing and training costs associated with our team of e-TeleQuote licensed health insurance agents. Other than costs incurred to assist beneficiaries with switching plans within the same carrier, we incur our entire cost of approved policies prior to enrollment and prior to receiving our first commission related payment. Factors that impact our costs of acquisition per approved policy include:
Other revenue. Other revenue recognized in the Senior Health segment includes other revenues received for providing marketing services and health risk assessment services to certain health insurance carriers. Marketing development revenue is based on meeting agreed-upon objectives with certain health insurance carriers. Marketing development revenue serves to offset contract acquisition costs associated with the distribution of approved policies. Agreements for marketing development revenue are generally short-term in nature and can vary from period to period. Marketing development payments received on a per approved policy basis are recognized in commissions and fees revenue. Health risk assessment services generate revenue from health insurance carriers by collecting information from beneficiaries during the sales process.
Corporate and Other Distributed Products Segment. We earn revenues and pay commissions and referral fees within the Corporate and Other Distributed Products segment for mortgage loan originations, prepaid legal services, auto and homeowners’ insurance referrals, and other financial products, all of which are originated by third parties. The Corporate and Other Distributed Products segment also includes in-force policies from several discontinued lines of insurance underwritten by National Benefit Life Insurance Company (“NBLIC”).
The Corporate and Other Distributed Products segment includes net investment income recognized by the Company. Net investment income is impacted by the size and performance of our invested asset portfolio, which can be influenced by interest rates, credit spreads, and the mix of invested assets. Net investment income also is influenced by short-term interest rates and the amount of cash and cash equivalents on hand.
The Corporate and Other Distributed Products segment also includes corporate income and expenses not allocated to our other segments, general and administrative expenses (other than expenses that are allocated to the Term Life Insurance, Investment and Savings Products, or Senior Health segments), interest expense on notes payable, redundant reserve financing transactions and our revolving credit facility (“Revolving Credit Facility”), as well as realized gains and losses on our invested asset portfolio.
Capital Structure. Our financial results are affected by our capital structure, which includes our senior unsecured notes (the “Senior Notes”), redundant reserve financing transactions, our Revolving Credit Facility, and our common stock. See Note 11 (Debt), Note 13 (Stockholders’ Equity) and Note 17 (Commitments and Contingent Liabilities) to our consolidated financial statements included elsewhere in this report for more information on changes in our capital structure.
Foreign Currency. The Canadian dollar is the functional currency for our Canadian subsidiaries and our consolidated financial results, reported in U.S. dollars, are affected by changes in the currency exchange rate. As such, the translated amount of revenues, expenses, assets and liabilities attributable to our Canadian subsidiaries will be higher or lower in periods where the Canadian dollar appreciates or weakens relative to the U.S. dollar, respectively.
The year-end exchange rates (U.S. dollar per Canadian dollar) used by the Company to translate our Canadian dollar functional currency assets and liabilities into U.S. dollars increased by 3% in 2023 from 2022. Also, the average exchange rates used by the Company in 2023 to translate our Canadian dollar functional currency revenues and expenses into U.S. dollars decreased 4% compared to 2022. The 2022 year-end exchange rates decreased by 7% from 2021 and the average exchange rates decreased 4% compared to 2021.
See the Results of Operations section, the Financial Condition section, and “Quantitative and Qualitative Disclosures About Market Risk – Canadian Currency Risk” and Note 3 (Segment and Geographical Information) to our consolidated financial statements included elsewhere in this report, for more information on our Canadian subsidiaries and the impact of foreign currency on our financial results.
Income Taxes. The profitability of the Company and its subsidiaries is affected by income taxes assessed by federal, state, and U.S. territorial jurisdictions in the U.S. and federal and provincial jurisdictions in Canada. Changes in tax legislation may impact the measurement of our deferred tax assets and liabilities and the amount of income tax expense we incur.
58
Critical Accounting Estimates
We prepare our financial statements in accordance with U.S. generally accepted accounting principles (“U.S. GAAP”). These principles are established primarily by the Financial Accounting Standards Board. The preparation of financial statements in conformity with U.S. GAAP requires us to make estimates and assumptions based on currently available information when recording transactions resulting from business operations. Our significant accounting policies are described in Note 1 (Description of Business, Basis of Presentation, and Summary of Significant Accounting Policies) to our consolidated financial statements included elsewhere in this report. The most significant items on our consolidated balance sheets are based on fair value determinations, accounting estimates and actuarial determinations, which are susceptible to changes in future periods and could affect our results of operations and financial position.
The estimates that we deem to be most critical to an understanding of our results of operations and financial position are those related to DAC, future policy benefit reserves and corresponding amounts recoverable from reinsurers, income taxes, renewal commissions receivable, goodwill and the valuation of investments. The preparation and evaluation of these critical accounting estimates involve the use of various assumptions developed from management’s analyses and judgments. Subsequent experience or use of other assumptions could produce significantly different results.
Deferred Policy Acquisition Costs. We defer incremental direct costs of successful contract acquisitions that result directly from and are essential to the contract transaction(s) and that would not have been incurred had the contract transaction(s) not occurred. These costs include commissions and policy issue expenses. Deferrable Term Life Insurance policy acquisition costs are amortized on a constant-level basis over the expected term of the contracts using face amount as the unit of measure. Interest is not accrued on unamortized DAC balances and DAC is not subject to impairment testing. Contracts are grouped by cohorts consistent with the grouping used in estimating the LFPB. The cohorts are defined by the legal entity that issued the policy and the year the policy was issued.
Assumptions of face amounts used to amortize DAC for term life policies, including persistency and mortality, are consistent with the assumptions used in estimating the LFPB. Changes in persistency would have the most notable impact on DAC amortization; however, the differences primarily affect DAC amortization on a go-forward basis. If annual lapse rate assumptions at each policy duration were 5% higher during 2023, we would have recognized approximately $9 million of additional amortization of DAC expense for 2023, before the impact of tax, and the rate of DAC amortization would increase in future years. Conversely, if annual lapse rate assumptions were 5% lower during 2023, we would have recognized approximately $9 million of lower DAC amortization for 2023, before the impact of tax, and the rate of DAC amortization would decrease in future years. We believe that a plus or minus 5% annual lapse rate change is a reasonably possible variation. Changes in persistency assumptions also impact the balance of future policy benefit reserves and reinsurance recoverables as discussed below.
For additional information on DAC, see Note 1 (Description of Business, Basis of Presentation, and Summary of Significant Accounting Policies) and Note 7 (Deferred Policy Acquisition Costs) to our consolidated financial statements included elsewhere in this report.
Future Policy Benefit Reserves and Reinsurance. Liabilities for future policy benefits on our term life insurance products are reserves established for death claims, waiver of premium benefits, and claim settlement expenses. The LFPB is calculated as the present value of expected future benefits less the present value of expected future net premiums receivable under the contracts. Net premiums are defined as the portion of policyholder gross premiums that are needed to pay for all benefits.
The assumptions underlying the LFPB include mortality, persistency, discount rates, disability rates, and other assumptions that reflect our best estimate based on our historical experience and modified, as necessary, to reflect non-recurring and/or anticipated trends.
The LFPB is estimated by grouping insurance policies into cohorts. Policy cohorts for the Term Life Insurance segment are based on the legal entity that issued the policy and the year the policy was issued.
The cash flows and assumptions underlying the LFPB are unlocked each quarter to reflect differences between actual and expected experience. In general, assumption changes, such as mortality, lapse and disability, to the extent necessary, are expected to only occur during the third quarter when we update our experience studies. However, they may occur at any time based on emerging experience.
The impact of unlocking assumptions, such as mortality, lapse and disability, will be partly reflected in the current period and partly spread to future periods based on the remaining duration of the impacted cohort(s). The catch-up is retroactive back to the later of the Transition Date or issue date, after reinsurance recoverables and is recognized as a remeasurement gain or loss as a separate component of benefits and claims expense in the consolidated statements of income.
The ceded policy reserve balances included in reinsurance recoverables are calculated in the same manner as the LFPB by cohort and apply best estimate assumptions and quarterly unlocking.
The Company uses discount rates applied by country to align with local currency cash flows. Discount rates consist of yield curves that are developed using Bloomberg’s Evaluated Pricing Product based on senior unsecured fixed rate bonds ratings of A+, A, or A-. The discount rate assumption is updated quarterly, and the impact of remeasuring the net LFPB, after reinsurance recoverables from changes in the locked-in discount rate assumption is reflected in other comprehensive income in the consolidated statements of comprehensive income.
59
The LFPB is necessarily based on estimates, assumptions and our analysis of historical experience. Factors that could cause prospective assumptions to be different from historical experience include but are not limited to changes to our term life product series, economic and societal trends, new pharmaceutical drugs, and the impact of regulatory changes. The assumptions and estimates underlying the LFPB require significant judgment, and therefore, are inherently uncertain. The following table provides illustrated net impact of changes in assumptions affecting both the LFPB and reinsurance recoverables that we believe are reasonably possible, before the impact of tax:
Assumption |
|
Sensitivity assumption change |
|
Estimated impact at December 31, 2023 |
Lapse |
|
5% decrease / 5% increase |
|
($33 million) / $33 million(1) |
Mortality |
|
5% increase / 5% decrease |
|
($31 million) / $31 million(1) |
Disability |
|
5% increase / 5% decrease |
|
($15 million) / $15 million(1) |
Discount rate |
|
100 bps decrease / 100 bps increase |
|
($567 million) / $691 million(2) |
(1) Changes in lapse, mortality and disability affect the benefits and claims expense on the consolidated statements of income. Estimated impacts show the (decrease) / increase in income before income taxes. The assumption change sensitivities shown are based on a consistent percentage change across all policy durations.
(2) Changes in discount rate affect the effect of change in discount rate assumptions on the liability for future policy benefits on the consolidated statements of comprehensive income. Estimated impacts show the (decrease) / increase in accumulated other comprehensive income before income taxes. The assumption change is based on a parallel shift in the discount rate curve.
As discussed above, changes in lapse, mortality, and disability assumptions would also affect the net premium ratio used to recognize benefits expenses in future periods.
For additional information on future policy benefits, reinsurance and the impact to accumulated other comprehensive income see Note 1 (Description of Business, Basis of Presentation, and Summary of Significant Accounting Policies), Note 6 (Reinsurance), and Note 10 (Future Policy Benefits) to our consolidated financial statements included elsewhere in this report.
Income Taxes. We account for income taxes using the asset and liability method. We recognize deferred tax assets and liabilities for the future tax consequences attributable to (i) temporary differences between the financial statement carrying amounts of existing assets and liabilities and their respective tax bases and (ii) operating loss and tax credit carryforwards. Deferred tax assets are recognized subject to management’s judgment that realization is more likely than not applicable to the periods in which we expect the temporary difference will reverse. Deferred tax assets and liabilities are measured using enacted tax rates expected to apply to taxable income in the years in which those temporary differences are expected to be recovered or settled.
In light of the multiple tax jurisdictions in which we operate, our tax returns are subject to routine audit by the Internal Revenue Service and other taxation authorities. These audits at times may produce alternative views regarding particular tax positions taken in the year(s) of review. As a result, the Company records uncertain tax positions, which require recognition at the time when it is deemed more likely than not that the position in question will be upheld. Although management believes that the judgment and estimates involved are reasonable and that the necessary provisions have been recorded, changes in circumstances or unexpected events could adversely affect our financial position, results of operations, and cash flows.
For additional information on income taxes, see Note 1 (Description of Business, Basis of Presentation, and Summary of Significant Accounting Policies) and Note 12 (Income Taxes) to our consolidated financial statements included elsewhere in this report.
Renewal Commissions Receivable. We earn commissions when e-TeleQuote enrolls Medicare beneficiaries in insurance policies offered by its customers, third-party health insurance carriers. We have no further obligations to our customers once an eligible Medicare beneficiary is approved for a policy by the customer. We are entitled to commissions at the time the initial policy is approved by the health insurance carrier and are entitled to renewal commissions for as long as the policy renews. The estimate of renewal commissions is part of the variable consideration recognized and requires significant judgment including determining the number of periods in which a renewal will occur and the value of those renewal commissions to be received if renewed. We utilize the expected value approach for this estimate, incorporating a combination of historical lapse data and effective commission rates to estimate forecasted renewal consideration. We apply a constraint on our estimate of renewal commissions so that it is probable that a significant reversal in the amount of cumulative revenue will not occur. Variable consideration in excess of the amount constrained is recognized in subsequent reporting periods when the uncertainty is resolved.
We utilize a practical expedient to estimate renewal commissions revenue by applying the use of a portfolio approach to policies grouped together by health insurance carrier, Medicare product type, and policy effective date. This provides a practical approach to estimating the renewal commissions expected to be collected by evaluating various factors, including but not limited to, contracted commission rates, disenrollment experience and renewal persistency rates. We continuously evaluate the assumptions and inputs into our calculation of renewal commissions revenue and refine our estimates based on current information. There could be situations where new facts or circumstances, that were not available at the time of the initial estimate, may indicate that the renewal commissions receivable recognized is higher or lower than our original expectation of renewal commissions that will be collected. In those situations, the renewal commissions receivable will be written down or up to its revised expected value by recording tail revenue adjustments. During 2023, we recorded $2.3 million in net positive tail revenue adjustments as retention for policies scheduled to renew was higher than expected.
Goodwill. In applying the acquisition method of accounting for the e-TeleQuote business combination, amounts assigned to identifiable assets and liabilities acquired were based on estimated fair values as of the date of acquisition, subject to certain
60
exceptions, with the remainder recorded as goodwill. Significant judgment is used to determine the value of the acquired assets and liabilities as well as the purchase consideration for non-controlling interests. Key assumptions used to develop these estimates include projected revenue, expenses, cash flows, weighted average cost of capital, estimates of customer turnover rates, estimates of terminal values, forward-looking estimates of peer company values, and assessment of the probabilities of the earnout metrics.
Goodwill is tested at the reporting unit level, all of which is attributable to the Senior Health segment (which is defined as the reporting unit). The annual date used by the Company to test goodwill for impairment is July 1. The Company will also test goodwill for impairment between annual tests if an event occurs or circumstances change that would more likely than not result in the fair value of the Senior Health reporting unit being lower than its carrying value.
During the annual impairment test as of July 1, 2023, the Company performed a quantitative impairment analysis using the income approach by preparing a discounted cash flow analysis to determine the reporting unit’s fair value. The discounted cash flow analysis included key assumptions such as the weighted average cost of capital, long-term growth rate and projected operating results such as approved policies, lifetime value of commissions, contract acquisition costs, operating expenses, collections of renewal commissions receivable, and utilization of net operating losses for income tax purposes. We did not utilize a market approach as part of the quantitative impairment analysis as we believe management’s expectations of the cash flows generated by the reporting unit were more relevant in determining fair value given inherent limitations in the credibility of available peer company data. The measurement of the reporting unit’s fair value is classified as a Level 3 fair value measurement given the significance of the unobservable inputs such as forecasted operating results and discount rates.
After the fair value of the reporting unit was determined, the Company calculated its carrying value by taking the reporting unit’s assets less its liabilities. The carrying value of the Senior Health reporting unit as of July 1, 2023 included remaining goodwill of $127.7 million after accumulated goodwill impairment charges of $136.0 million that were recognized in previous periods. The carrying value of the reporting unit was then compared to its fair value to determine the extent of any goodwill impairment. Based on this 2023 analysis, the fair value exceeded the carrying value of the reporting unit and, therefore, we did not recognize any additional non-cash goodwill impairment charges during 2023. The determination of whether the carrying value of the reporting unit exceeds its fair value involves a high degree of estimation and can be affected by a number of industry and company-specific risk factors that are subject to change over time.
For additional information on goodwill, see Note 1 (Description of Business, Basis of Presentation, and Summary of Significant Accounting Policies) and Note 22 (Goodwill) to our consolidated financial statements included elsewhere in this report.
Invested Assets. We hold primarily fixed-maturity securities, including bonds and redeemable preferred stocks. We have classified these invested assets as available-for-sale, except for the securities of our U.S. broker-dealer subsidiaries, which we have classified as trading securities. We also hold a credit-enhanced note, which we classified as a held-to-maturity security that was issued in exchange for a surplus note (the “Surplus Note”) with an equal principal amount as part of a redundant reserve financing transaction. All of these securities are carried at fair value, except for the held-to-maturity security, which is carried at amortized cost. Unrealized gains and losses on available-for-sale securities are included as a separate component of other comprehensive income in our consolidated statements of comprehensive income.
We also hold equity securities, including common and non-redeemable preferred stock. These equity securities are measured at fair value, and changes in unrealized gains and losses are recognized in net income. Changes in fair value of trading securities are included in net income in our consolidated statements of income in the period in which the change occurred.
Fair value. Fair value is the price that would be received upon the sale of an asset in an orderly transaction between market participants at the measurement date. Fair value measurements are based upon observable and unobservable inputs. Observable inputs reflect market data obtained from independent sources, while unobservable inputs reflect our view of market assumptions in the absence of observable market information. We classify and disclose all invested assets carried at fair value in one of the three fair value measurement hierarchy categories prescribed by U.S. GAAP.
As of each reporting period, we classify all invested assets in their entirety based on the lowest level of input that is significant to the fair value measurement. Significant levels of estimation and judgment are required to determine the fair value of certain of our investments. The factors influencing these estimations and judgments are subject to change in subsequent reporting periods.
Credit losses for available-for-sale fixed-maturity securities. For available-for-sale securities in an unrealized loss position that we intend to sell or would more-likely-than-not be required to sell before the expected recovery of the amortized cost basis, we recognize the impairment as a credit loss in our consolidated statements of income by writing down the amortized cost basis to the fair value. For available-for-sale securities in an unrealized loss position that we do not intend to sell or it is not more-likely-than-not that we will be required to sell before the expected recovery of the amortized cost basis, we recognize the portion of the impairment that is due to a credit loss in our consolidated statements of income through an allowance for credit losses. We reverse credit losses previously recognized in the allowance for credit losses in situations where the estimate of credit losses on those securities has declined. We do not consider the length of time an available-for-sale security has been in an unrealized loss position when estimating credit losses.
Analyses that we perform to determine whether an impairment is due to a credit loss or other factors involve the use of estimates, assumptions, and subjectivity. We evaluate a number of quantitative and qualitative factors when determining the credit loss on
61
individual securities, including issuer-specific risks as well as relevant macroeconomic risks. If these factors or future events change, we could experience material credit losses recognized in our consolidated statements of income for available-for-sale securities in future periods, which could adversely affect our financial condition, results of operations and the size and quality of our invested assets portfolio.
For additional information on our invested assets, see Note 1 (Description of Business, Basis of Presentation, and Summary of Significant Accounting Policies), Note 4 (Investments) and Note 5 (Fair Value of Financial Instruments) to our consolidated financial statements included elsewhere in this report.
Results of Operations
Revenues. Our revenues consist of the following:
Benefits and Expenses. Our operating expenses consist of the following:
62
Insurance expenses and other operating expenses directly attributable to the Term Life Insurance, Investment and Savings Products and Senior Health segments are recorded directly to the applicable segment. We allocate certain other revenue and operating expenses that are not directly attributable to a specific operating segment using methods expected to reasonably measure the benefit received by each reporting segment. Such methods include time studies, recorded usage, revenue distribution, and sales force representative distribution. These allocated items include fees charged for access to POL and costs incurred for technology, sales force support, occupancy and other general and administrative costs. Costs that are not directly charged or allocated to our three primary operating segments are included in the Corporate and Other Distributed Products segment.
Primerica, Inc. and Subsidiaries Results. Our results of operations for the years ended December 31, 2023, 2022, and 2021 were as follows:
|
|
Year ended December 31, |
|
|
2023 vs. 2022 change |
|
|
2022 vs. 2021 change |
|
|||||||||||||||||||
|
|
2023 |
|
|
2022 |
|
|
2021 |
|
|
$ |
|
|
% |
|
|
$ |
|
|
% |
|
|||||||
|
|
(Dollars in thousands) |
|
|||||||||||||||||||||||||
Revenues: |
|
|
|
|
|
|
|
|
|
|
|
|
|
|
|
|
|
|
|
|
|
|||||||
Direct premiums |
|
$ |
3,312,125 |
|
|
$ |
3,230,120 |
|
|
$ |
3,122,148 |
|
|
$ |
82,005 |
|
|
|
3 |
% |
|
$ |
107,972 |
|
|
|
3 |
% |
Ceded premiums |
|
|
(1,651,811 |
) |
|
|
(1,629,892 |
) |
|
|
(1,616,264 |
) |
|
|
21,919 |
|
|
|
1 |
% |
|
|
13,628 |
|
|
* |
|
|
Net premiums |
|
|
1,660,314 |
|
|
|
1,600,228 |
|
|
|
1,505,884 |
|
|
|
60,086 |
|
|
|
4 |
% |
|
|
94,344 |
|
|
|
6 |
% |
Commissions and fees |
|
|
950,416 |
|
|
|
944,676 |
|
|
|
1,042,813 |
|
|
|
5,740 |
|
|
* |
|
|
|
(98,137 |
) |
|
|
(9 |
)% |
|
Investment income net of investment expenses |
|
|
201,311 |
|
|
|
156,987 |
|
|
|
142,795 |
|
|
|
44,324 |
|
|
|
28 |
% |
|
|
14,192 |
|
|
|
10 |
% |
Interest expense on surplus note |
|
|
(65,474 |
) |
|
|
(63,922 |
) |
|
|
(62,207 |
) |
|
|
1,552 |
|
|
|
2 |
% |
|
|
1,715 |
|
|
|
3 |
% |
Net investment income |
|
|
135,837 |
|
|
|
93,065 |
|
|
|
80,588 |
|
|
|
42,772 |
|
|
|
46 |
% |
|
|
12,477 |
|
|
|
15 |
% |
Realized investment gains (losses) |
|
|
(645 |
) |
|
|
1,444 |
|
|
|
4,665 |
|
|
|
(2,089 |
) |
|
* |
|
|
|
(3,221 |
) |
|
* |
|
||
Other investment gains (losses) |
|
|
(5,251 |
) |
|
|
(2,439 |
) |
|
|
1,207 |
|
|
|
(2,812 |
) |
|
* |
|
|
|
(3,646 |
) |
|
* |
|
||
Investment gains (losses) |
|
|
(5,896 |
) |
|
|
(995 |
) |
|
|
5,872 |
|
|
|
(4,901 |
) |
|
* |
|
|
|
(6,867 |
) |
|
* |
|
||
Other, net |
|
|
75,020 |
|
|
|
83,159 |
|
|
|
74,575 |
|
|
|
(8,139 |
) |
|
|
(10 |
)% |
|
|
8,584 |
|
|
|
12 |
% |
Total revenues |
|
|
2,815,691 |
|
|
|
2,720,133 |
|
|
|
2,709,732 |
|
|
|
95,558 |
|
|
|
4 |
% |
|
|
10,401 |
|
|
* |
|
|
|
|
|
|
|
|
|
|
|
|
|
|
|
|
|
|
|
|
|
|
|
|
|||||||
Benefits and expenses: |
|
|
|
|
|
|
|
|
|
|
|
|
|
|
|
|
|
|
|
|
|
|||||||
Benefits and claims |
|
|
642,979 |
|
|
|
632,403 |
|
|
|
602,007 |
|
|
|
10,576 |
|
|
|
2 |
% |
|
|
30,396 |
|
|
|
5 |
% |
Future policy benefits remeasurement (gain) loss |
|
|
(384 |
) |
|
|
1,626 |
|
|
|
1,297 |
|
|
|
(2,010 |
) |
|
* |
|
|
|
329 |
|
|
* |
|
||
Amortization of DAC |
|
|
275,816 |
|
|
|
261,629 |
|
|
|
238,270 |
|
|
|
14,187 |
|
|
|
5 |
% |
|
|
23,359 |
|
|
|
10 |
% |
Sales commissions |
|
|
457,444 |
|
|
|
462,764 |
|
|
|
522,308 |
|
|
|
(5,320 |
) |
|
|
(1 |
)% |
|
|
(59,544 |
) |
|
|
(11 |
)% |
Insurance expenses |
|
|
235,460 |
|
|
|
235,405 |
|
|
|
202,605 |
|
|
|
55 |
|
|
* |
|
|
|
32,800 |
|
|
|
16 |
% |
|
Insurance commissions |
|
|
34,222 |
|
|
|
30,261 |
|
|
|
34,532 |
|
|
|
3,961 |
|
|
|
13 |
% |
|
|
(4,271 |
) |
|
|
(12 |
)% |
Contract acquisition costs |
|
|
55,233 |
|
|
|
68,431 |
|
|
|
52,788 |
|
|
|
(13,198 |
) |
|
|
(19 |
)% |
|
|
15,643 |
|
|
|
30 |
% |
Interest expense |
|
|
26,594 |
|
|
|
27,237 |
|
|
|
30,618 |
|
|
|
(643 |
) |
|
|
(2 |
)% |
|
|
(3,381 |
) |
|
|
(11 |
)% |
Goodwill impairment loss |
|
|
- |
|
|
|
60,000 |
|
|
|
76,000 |
|
|
|
(60,000 |
) |
|
* |
|
|
|
(16,000 |
) |
|
* |
|
||
Loss on extinguishment of debt |
|
|
- |
|
|
|
- |
|
|
|
8,927 |
|
|
|
- |
|
|
* |
|
|
|
(8,927 |
) |
|
* |
|
||
Other operating expenses |
|
|
336,647 |
|
|
|
320,394 |
|
|
|
296,851 |
|
|
|
16,253 |
|
|
|
5 |
% |
|
|
23,543 |
|
|
|
8 |
% |
Total benefits and expenses |
|
|
2,064,011 |
|
|
|
2,100,150 |
|
|
|
2,066,203 |
|
|
|
(36,139 |
) |
|
|
(2 |
)% |
|
|
33,947 |
|
|
|
2 |
% |
Income before income taxes |
|
|
751,680 |
|
|
|
619,983 |
|
|
|
643,529 |
|
|
|
131,697 |
|
|
|
21 |
% |
|
|
(23,546 |
) |
|
|
(4 |
)% |
Income taxes |
|
|
175,079 |
|
|
|
152,953 |
|
|
|
167,544 |
|
|
|
22,126 |
|
|
|
14 |
% |
|
|
(14,591 |
) |
|
|
(9 |
)% |
Net income |
|
|
576,601 |
|
|
|
467,030 |
|
|
|
475,985 |
|
|
|
109,571 |
|
|
|
23 |
% |
|
|
(8,955 |
) |
|
|
(2 |
)% |
Net income (loss) attributable to noncontrolling interests |
|
|
- |
|
|
|
(5,038 |
) |
|
|
(1,377 |
) |
|
|
5,038 |
|
|
* |
|
|
|
(3,661 |
) |
|
* |
|
||
Net income attributable to Primerica, Inc. |
|
$ |
576,601 |
|
|
$ |
472,068 |
|
|
$ |
477,362 |
|
|
$ |
104,533 |
|
|
|
22 |
% |
|
$ |
(5,294 |
) |
|
|
(1 |
)% |
* Less than 1% or not meaningful
2023 compared to 2022
Total revenues. Total revenues increased in 2023 from 2022 due to increases in net premiums earned in our Term Life Insurance segment, asset-based commissions and fees earned in our Investment and Savings Products segment, and net investment income earned by our invested asset portfolio. Partially offsetting these increases in total revenues were lower sales-based commissions and fees earned in our Investment and Savings Products segment. These movements are further discussed in detail in the Segment Results sections below.
Net investment income increased in 2023 from 2022 due primarily to $23.3 million from higher yields in the invested asset portfolio, a $9.4 million higher total return on the deposit asset backing our 10% coinsurance agreement and $8.5 million from a larger invested asset portfolio compared to the prior year. Investment income net of investment expenses includes interest earned on our held-to-maturity asset, which is offset by interest expense on the Surplus Note, thereby eliminating any impact on net investment income.
63
Amounts recognized for each line item will remain offsetting and will fluctuate from period to period along with the principal amounts of the held-to-maturity asset and the Surplus Note based on the balance of reserves being contractually supported under a redundant reserve financing transaction used by Vidalia Re, Inc. (“Vidalia Re”). For more information on the Surplus Note, see Note 4 (Investments) and Note 11 (Debt) to our consolidated financial statements included elsewhere in this report.
Investment losses increased during 2023 compared to 2022 primarily due to a $2.2 million credit loss recognized for debt securities, associated with a specific issuer, that we had designated as intending to sell, partially offset by a $0.4 million gain from the subsequent sale of these securities. In addition, we recognized a $3.1 million negative mark-to-market adjustment on equity securities held within our investment portfolio during 2023 compared to a $2.4 million negative mark-to-market adjustment during 2022.
Other, net revenues decreased in 2023 from 2022, primarily due to a decrease in revenue earned for providing agreed-upon marketing services to health insurance carriers in the Senior Health segment during 2023. Refer to the Senior Health segment results below for further discussion.
Total benefits and expenses. Total benefits and expenses decreased in 2023 from 2022 largely due to a non-cash goodwill impairment charge of $60.0 million recorded in our Senior Health segment during 2022, lower sales-based commissions expenses in our Investment and Savings Products segment, and lower contract acquisition costs in our Senior Health segment. Partially offsetting the decrease in total benefits and expenses were increases in asset-based sales commissions expenses in our Investment and Savings Products segment, amortization of DAC, and other operating expenses during 2023. The increase in other operating expenses was due to increased technology spending as well as higher employee-related and growth-related costs. These movements are discussed in further detail in the Segment Results section below.
Income taxes. Our effective income tax rate for 2023 was 23.3% compared to 24.7% in 2022. Excluding the non-cash, non-deductible goodwill impairment charge in 2022, the effective income tax rate was 22.5% in 2022. The year-over-year increase in the effective tax rate excluding the goodwill impairment charge was primarily due to higher state income taxes in 2023.
2022 compared to 2021
Total revenues. Total revenues increased in 2022 from 2021 primarily driven by growth in net premiums in the Term Life Insurance segment. Partially offsetting this increase were lower commissions and fees in 2022 versus 2021 due to lower sales-based revenues in our Investment and Savings Products segment. These movements are further discussed in detail in the Segment Results sections below.
Net investment income increased in 2022 from 2021 due to $9.0 million from higher yields in the invested asset portfolio and $5.4 million from a larger invested asset portfolio compared to the prior year. As noted above, investment income net of investment expenses includes interest earned on our held-to-maturity asset, which is offset by interest expense on the Surplus Note, thereby eliminating any impact on net investment income.
Investment gains (losses) decreased to a loss during 2022 compared to a gain in 2021 primarily due to a $2.4 million negative mark-to-market adjustment on equity securities held within our investment portfolio in 2022 as a result of negative equity market performance compared to a $2.4 million positive mark-to-market adjustment on equity securities held within our investment portfolio in the comparable 2021 period and a $3.2 million decrease in realized investment gains from sales of fixed-maturity securities from 2021 to 2022.
Other, net revenues increased in 2022 from 2021 primarily due to the timing of the acquisition of e-TeleQuote on July 1, 2021. A full year of marketing development revenue was included in the Senior Health segment in 2022 compared to only six months in 2021. Also contributing to the increase in other, net revenues was an increase in fees received for access to POL, our primary sales force support tool, consistent with subscriber growth.
Total benefits and expenses. Total benefits and expenses increased in 2022 from 2021 primarily due to increased insurance expenses, benefits and claims, other operating expenses, amortization of DAC and contract acquisition costs in 2022. Benefits and claims and amortization of DAC increased primarily due to growth in our Term Life Insurance business. Insurance expenses and other operating expenses increased due to higher costs associated with sales force leadership events, which included one additional event than a typical year. Contract acquisition costs increased due to the acquisition of e-TeleQuote on July 1, 2021. These increases were partially offset by lower sales commissions in line with lower commissions and fees revenue in the Investment and Savings Products segment as discussed above, lower non-cash goodwill impairment charge in the Senior Health segment, and a nonrecurring loss on extinguishment of debt as a result of the 2021 accelerated repayment of senior notes issued in 2012 that were scheduled to mature in 2022.
Income taxes. Our effective income tax rate for 2022 was 24.7% compared to 26.0% in 2021. The decrease in the effective tax rate in 2022 was driven by a smaller non-cash goodwill impairment charge that is not deductible for income tax purposes, state income tax benefits at e-TeleQuote and revaluation of Canadian deferred tax assets as a result of a Canadian statutory tax rate increase.
64
Net income (loss) attributable to noncontrolling interests. The net loss attributable to noncontrolling interest increased during 2022 compared to 2021 primarily due to higher operating losses incurred by the Senior Health segment prior to the redemption of the noncontrolling interest on July 1, 2022.
For additional information, see the discussions of results of operations by segment below.
Term Life Insurance Segment. Our results for the Term Life Insurance segment for the years ended December 31, 2023, 2022, and 2021 were as follows:
|
|
Year ended December 31, |
|
|
2023 vs. 2022 change |
|
|
2022 vs. 2021 change |
|
|||||||||||||||||||
|
|
2023 |
|
|
2022 |
|
|
2021 |
|
|
$ |
|
|
% |
|
|
$ |
|
|
% |
|
|||||||
|
|
(Dollars in thousands) |
|
|||||||||||||||||||||||||
Revenues: |
|
|
|
|
|
|
|
|
|
|
|
|
|
|
|
|
|
|
|
|
|
|||||||
Direct premiums |
|
$ |
3,292,760 |
|
|
$ |
3,209,088 |
|
|
$ |
3,099,828 |
|
|
$ |
83,672 |
|
|
|
3 |
% |
|
$ |
109,260 |
|
|
|
4 |
% |
Ceded premiums |
|
|
(1,648,004 |
) |
|
|
(1,623,442 |
) |
|
|
(1,609,598 |
) |
|
|
24,562 |
|
|
|
2 |
% |
|
|
13,844 |
|
|
* |
|
|
Net Premiums |
|
|
1,644,756 |
|
|
|
1,585,646 |
|
|
|
1,490,230 |
|
|
|
59,110 |
|
|
|
4 |
% |
|
|
95,416 |
|
|
|
6 |
% |
Other, net |
|
|
48,286 |
|
|
|
50,320 |
|
|
|
48,970 |
|
|
|
(2,034 |
) |
|
|
(4 |
)% |
|
|
1,350 |
|
|
|
3 |
% |
Total revenues |
|
|
1,693,042 |
|
|
|
1,635,966 |
|
|
|
1,539,200 |
|
|
|
57,076 |
|
|
|
3 |
% |
|
|
96,766 |
|
|
|
6 |
% |
Benefits and expenses: |
|
|
|
|
|
|
|
|
|
|
|
|
|
|
|
|
|
|
|
|
|
|||||||
Benefits and claims |
|
|
622,084 |
|
|
|
619,997 |
|
|
|
589,958 |
|
|
|
2,087 |
|
|
* |
|
|
|
30,039 |
|
|
|
5 |
% |
|
Future policy benefits remeasurement (gain) loss |
|
|
(213 |
) |
|
|
554 |
|
|
|
911 |
|
|
|
(767 |
) |
|
* |
|
|
|
(357 |
) |
|
* |
|
||
Amortization of DAC |
|
|
268,803 |
|
|
|
254,875 |
|
|
|
231,380 |
|
|
|
13,928 |
|
|
|
5 |
% |
|
|
23,495 |
|
|
|
10 |
% |
Insurance expenses |
|
|
230,390 |
|
|
|
230,796 |
|
|
|
197,262 |
|
|
|
(406 |
) |
|
* |
|
|
|
33,534 |
|
|
|
17 |
% |
|
Insurance commissions |
|
|
19,814 |
|
|
|
15,335 |
|
|
|
18,457 |
|
|
|
4,479 |
|
|
|
29 |
% |
|
|
(3,122 |
) |
|
|
(17 |
)% |
Total benefits and expenses |
|
|
1,140,878 |
|
|
|
1,121,557 |
|
|
|
1,037,968 |
|
|
|
19,321 |
|
|
|
2 |
% |
|
|
83,589 |
|
|
|
8 |
% |
Income before income taxes |
|
$ |
552,164 |
|
|
$ |
514,409 |
|
|
$ |
501,232 |
|
|
$ |
37,755 |
|
|
|
7 |
% |
|
$ |
13,177 |
|
|
|
3 |
% |
* Less than 1% or not meaningful
2023 compared to 2022
Net premiums. Direct premiums increased in 2023 from 2022 largely due to the layering effect of new policy sales that contributed to growth in the in-force book of business. In addition, direct premiums continued to increase in 2023 despite the impact of elevated lapses due to the growth in new policy sales. This increase is partially offset by an increase in ceded premiums, which includes $61.9 million in higher non-level YRT reinsurance ceded premiums as business not subject to the IPO coinsurance transactions ages, reduced by $37.4 million in lower coinsurance ceded premiums due to the run-off of business subject to the IPO coinsurance transactions.
Benefits and claims. Benefits and claims were generally flat during 2023 compared to 2022. Direct benefits and claims increased with the growth in the business but were mostly offset by an increase in ceded benefit reserves from YRT reinsurance. YRT reinsurance ceded benefit reserves will fluctuate based on the specifics of premiums ceded and claims incurred during each period. Year-over-year claims incurred in 2023 were flat compared to 2022.
Future policy benefits remeasurement (gain) loss. Future policy benefits remeasurement (gain) loss was generally flat during 2023 compared to 2022 and represent differences in experience variances that occurred in each respective period. The portion of experience variances recognized in net income during each period will increase as we move further away from the Transition Date of LDTI.
Amortization of DAC. The amortization of DAC increased in 2023 from 2022 primarily due to continued growth in the in-force book of business.
Insurance expenses. Insurance expenses decreased slightly during 2023 compared to 2022 due to costs incurred for the additional sales force leadership event held in 2022 largely offset by higher growth-related, employee-related, and technology costs in 2023.
Insurance commissions. Insurance commissions increased in 2023 from 2022 as a result of higher non-deferrable sales force promotional activities.
2022 compared to 2021
Net premiums. Direct premiums increased in 2022 from 2021 largely due to sales of new policies that contributed to growth in the in-force book of business. This is partially offset by an increase in ceded premiums, which includes $55.5 million in higher non-level YRT reinsurance ceded premiums as business not subject to the IPO coinsurance transactions ages, reduced by $41.6 million in lower coinsurance ceded premiums due to the run-off of business subject to the IPO coinsurance transactions.
Benefits and claims. Benefits and claims increased in 2022 from 2021 consistent with the increase in net premiums.
Future policy benefits remeasurement (gain) loss. Future policy benefits remeasurement (gain) loss was generally flat during 2022 compared to 2021.
65
Amortization of DAC. The amortization of DAC increased in 2022 from 2021 primarily due to continued growth in the in-force book of business.
Insurance expenses. Insurance expenses increased in 2022 from 2021 due to higher costs associated with growth in the sales force and the business and higher employee compensation costs. Also contributing to the increase were higher costs associated with adding the previously postponed biennial convention to our normal cycle of sales force leadership events.
Insurance commissions. Insurance commissions decreased in 2022 from 2021 as a result of higher non-deferrable sales force promotional activities offered in 2021 to incentivize the independent sales force during the COVID-19 pandemic.
Investment and Savings Products Segment. Our results of operations for the Investment and Savings Products segment for the years ended December 31, 2023, 2022, and 2021 were as follows:
|
|
Year ended December 31, |
|
|
2023 vs. 2022 change |
|
|
2022 vs. 2021 change |
|
|||||||||||||||||||
|
|
2023 |
|
|
2022 |
|
|
2021 |
|
|
$ |
|
|
% |
|
|
$ |
|
|
% |
|
|||||||
|
|
(Dollars in thousands) |
|
|||||||||||||||||||||||||
Revenues: |
|
|
|
|
|
|
|
|
|
|
|
|
|
|
|
|
|
|
|
|
|
|||||||
Commissions and fees: |
|
|
|
|
|
|
|
|
|
|
|
|
|
|
|
|
|
|
|
|
|
|||||||
Sales-based revenues |
|
$ |
296,617 |
|
|
$ |
326,378 |
|
|
$ |
401,508 |
|
|
$ |
(29,761 |
) |
|
|
(9 |
)% |
|
$ |
(75,130 |
) |
|
|
(19 |
)% |
Asset-based revenues |
|
|
462,955 |
|
|
|
434,053 |
|
|
|
441,303 |
|
|
|
28,902 |
|
|
|
7 |
% |
|
|
(7,250 |
) |
|
|
(2 |
)% |
Account-based revenues |
|
|
93,189 |
|
|
|
90,391 |
|
|
|
86,939 |
|
|
|
2,798 |
|
|
|
3 |
% |
|
|
3,452 |
|
|
|
4 |
% |
Other, net |
|
|
12,504 |
|
|
|
12,610 |
|
|
|
12,097 |
|
|
|
(106 |
) |
|
* |
|
|
|
513 |
|
|
|
4 |
% |
|
Total revenues |
|
|
865,265 |
|
|
|
863,432 |
|
|
|
941,847 |
|
|
|
1,833 |
|
|
* |
|
|
|
(78,415 |
) |
|
|
(8 |
)% |
|
Expenses: |
|
|
|
|
|
|
|
|
|
|
|
|
|
|
|
|
|
|
|
|
|
|||||||
Amortization of DAC |
|
|
5,479 |
|
|
|
5,581 |
|
|
|
5,511 |
|
|
|
(102 |
) |
|
|
(2 |
)% |
|
|
70 |
|
|
|
1 |
% |
Insurance commissions |
|
|
13,148 |
|
|
|
13,834 |
|
|
|
14,904 |
|
|
|
(686 |
) |
|
|
(5 |
)% |
|
|
(1,070 |
) |
|
|
(7 |
)% |
Sales commissions: |
|
|
|
|
|
|
|
|
|
|
|
|
|
|
|
|
|
|
|
|
|
|||||||
Sales-based |
|
|
212,482 |
|
|
|
234,711 |
|
|
|
287,359 |
|
|
|
(22,229 |
) |
|
|
(9 |
)% |
|
|
(52,648 |
) |
|
|
(18 |
)% |
Asset-based |
|
|
226,542 |
|
|
|
206,838 |
|
|
|
206,201 |
|
|
|
19,704 |
|
|
|
10 |
% |
|
|
637 |
|
|
* |
|
|
Other operating expenses |
|
|
164,788 |
|
|
|
156,578 |
|
|
|
150,130 |
|
|
|
8,210 |
|
|
|
5 |
% |
|
|
6,448 |
|
|
|
4 |
% |
Total expenses |
|
|
622,439 |
|
|
|
617,542 |
|
|
|
664,105 |
|
|
|
4,897 |
|
|
* |
|
|
|
(46,563 |
) |
|
|
(7 |
)% |
|
Income before income taxes |
|
$ |
242,826 |
|
|
$ |
245,890 |
|
|
$ |
277,742 |
|
|
$ |
(3,064 |
) |
|
|
(1 |
)% |
|
$ |
(31,852 |
) |
|
|
(11 |
)% |
* Less than 1% or not meaningful
2023 compared to 2022
Commissions and fees. Commissions and fees increased slightly during 2023 compared to 2022 led by higher asset-based revenues. The year-over-year increase in asset-based revenues was higher than the year-over-year increase in average client asset values due to a mix shift to asset-based products that earn higher fees, including managed accounts and Canadian mutual funds under the new principal distributor model. Also contributing to the increase in commissions and fees in 2023 were higher account-based revenues due to the cumulative effect of incremental retail mutual funds sales that we service on our transfer agent recordkeeping platform. Substantially offsetting the increase were lower sales-based revenues during 2023 primarily due to the adverse impact on revenue-generating product sales from the high cost of living and the availability of high yield money market and savings account alternatives in the first half of 2023. Another contributing factor to the decrease in sales-based revenues was the discontinuation of most up-front sales-based revenue on the sale of Canadian mutual funds, which are now sold under the principal distributor model. The principal distributor funds we now distribute in Canada primarily shift the revenue we earn to asset-based that is recognized over time.
Sales commissions. The decrease in sales-based commissions in 2023 from 2022 was in line with the decrease in sales-based revenue. Asset-based commissions were up for 2023 and were generally consistent with the movement in asset-based revenues when excluding Canadian segregated funds revenue. Asset-based expenses for our Canadian segregated funds are reflected within insurance commissions and amortization of DAC.
Other operating expenses. Other operating expenses increased in 2023 from 2022 due to increased employee-related and technology costs.
2022 compared to 2021
Commissions and fees. Commissions and fees decreased in 2022 from 2021 driven by lower sales-based revenues in 2022 as investor demand for mutual fund products and variable annuity products weakened due to volatility in capital markets. Also contributing to the decrease in 2022 were lower asset-based revenues, driven by negative equity market performance, partially offset by positive net flows.
Sales commissions. The decrease in sales-based commissions in 2022 from 2021 was generally in line with the decrease in sales-based revenue. Asset-based commissions were relatively flat for 2022 and were consistent with the movement in asset-based revenues,
66
excluding the Canadian segregated funds revenue. Asset-based expenses for our Canadian segregated funds are reflected within insurance commissions and amortization of DAC.
Other operating expenses. Other operating expenses increased in 2022 from 2021 due to higher costs associated with adding the previously postponed biennial convention to our normal cycle of sales force leadership events and higher expenses to support growth in managed accounts assets.
Senior Health Segment. Our results of operations for the Senior Health segment for the years ended December 31, 2023, 2022, and 2021 were as follows:
|
|
Year ended December 31, |
|
|
2023 vs. 2022 change |
|
|
2022 vs. 2021 change |
|
|||||||||||||||||||
|
|
2023 |
|
|
2022 |
|
|
2021(1) |
|
|
$ |
|
|
% |
|
|
$ |
|
|
% |
|
|||||||
|
|
(Dollars in thousands) |
|
|||||||||||||||||||||||||
Revenues: |
|
|
|
|
|
|
|
|
|
|
|
|
|
|
|
|
|
|
|
|
|
|||||||
Commissions and fees(2) |
|
$ |
57,563 |
|
|
$ |
47,420 |
|
|
$ |
50,903 |
|
|
$ |
10,143 |
|
|
|
21 |
% |
|
$ |
(3,483 |
) |
|
|
(7 |
)% |
Other, net |
|
|
9,621 |
|
|
|
15,262 |
|
|
|
9,537 |
|
|
|
(5,641 |
) |
|
|
(37 |
)% |
|
|
5,725 |
|
|
|
60 |
% |
Total revenues |
|
|
67,184 |
|
|
|
62,682 |
|
|
|
60,440 |
|
|
|
4,502 |
|
|
|
7 |
% |
|
|
2,242 |
|
|
|
4 |
% |
|
|
|
|
|
|
|
|
|
|
|
|
|
|
|
|
|
|
|
|
|
|
|||||||
Expenses: |
|
|
|
|
|
|
|
|
|
|
|
|
|
|
|
|
|
|
|
|
|
|||||||
Contract acquisition costs |
|
|
55,233 |
|
|
|
68,431 |
|
|
|
52,788 |
|
|
|
(13,198 |
) |
|
|
(19 |
)% |
|
|
15,643 |
|
|
|
30 |
% |
Goodwill impairment loss |
|
|
- |
|
|
|
60,000 |
|
|
|
76,000 |
|
|
|
(60,000 |
) |
|
* |
|
|
|
(16,000 |
) |
|
* |
|
||
Other operating expenses |
|
|
32,009 |
|
|
|
32,924 |
|
|
|
16,702 |
|
|
|
(915 |
) |
|
|
(3 |
)% |
|
|
16,222 |
|
|
|
97 |
% |
Total expenses |
|
|
87,242 |
|
|
|
161,355 |
|
|
|
145,490 |
|
|
|
(74,113 |
) |
|
|
(46 |
)% |
|
|
15,865 |
|
|
|
11 |
% |
Income (loss) before income taxes |
|
$ |
(20,058 |
) |
|
$ |
(98,673 |
) |
|
$ |
(85,050 |
) |
|
$ |
78,615 |
|
|
|
80 |
% |
|
$ |
(13,623 |
) |
|
|
(16 |
)% |
* Less than 1% or not meaningful
2023 compared to 2022
Commissions and fees. Excluding the impact of tail revenue adjustments, commissions and fees decreased during 2023 compared to 2022 as a result of lower approved policy sales volumes in 2023 given the reduction in tenured e-TeleQuote licensed health insurance agents during the second half of 2023 as well as the Company’s efforts during the first half of 2023 to control growth in favor of developing more efficient lead procurement and conversion. There was a positive tail revenue adjustment of $2.3 million recorded during 2023 due to higher commission rates and stable policy churn compared to a negative tail revenue adjustment of $18.9 million recorded during 2022 as discussed below. Also contributing to the change in commissions and fees in 2023 is the inclusion of approximately $3 million in marketing development revenues that are now earned on a per policy basis and presented in commissions and fees revenue instead of in other, net revenue. During the most recent AEP, our contracts for most of our marketing development revenue arrangements were shifted to a per approved policy model; therefore, we classified revenue from these arrangements of approximately $3 million in commissions and fees revenue instead of other, net revenue in 2023.
Other, net. The largest contributor to the decrease in other, net revenue in 2023 compared with 2022 is the change in presentation of approximately $3 million in marketing development revenues as noted in the preceding paragraph. In addition, marketing development revenues decreased during 2023 compared to 2022 due to lower lead acquisition volumes and expenses.
Contract acquisition costs. Contract acquisition costs decreased during 2023 compared to 2022 primarily due to lower approved policy volumes.
Goodwill impairment loss. There was no goodwill impairment charge recognized during 2023 compared to a $60.0 million non-cash goodwill impairment charge recognized during 2022. The charge represented the excess of the Senior Health reporting unit’s carrying value over its estimated fair value as of July 1, 2022. Refer to Note 22 (Goodwill) within our consolidated financial statements included elsewhere in this report for more information.
Other operating expenses. Other operating expenses during 2023 did not change significantly compared to 2022.
2022 compared to 2021
Commissions and fees. Excluding the impact of tail revenue adjustments, commissions and fees increased during 2022 compared to 2021 primarily due to the timing of the acquisition of e-TeleQuote on July 1, 2021. As a result, 2022 includes a full year of operations compared to only six months in 2021. This increase was completely offset by the recognition of $18.9 million of net negative tail revenue adjustments in 2022 as a result of lower than expected renewals and refined renewal estimates on policies approved in prior
67
periods. The negative tail revenue adjustment offset commissions and fees revenue of $66.3 million recognized for the lifetime value of commissions for policies approved during 2022. In comparison, a negative tail adjustment of $4.9 million was recognized during 2021. Also contributing to the year-over-year change in commissions and fees in 2022 compared to 2021 was lower sales volume during AEP due to our strategic initiative to limit the number of licensed health insurance agents.
Other, net. Marketing development revenue increased during 2022 compared to 2021 primarily due to the timing of the acquisition of e-TeleQuote on July 1, 2021. As a result, 2022 includes a full year of operations compared to only six months in 2021. Partially offsetting the increase in marketing development revenue was lower year-over-year amounts earned during AEP in connection with lower year-over-year AEP approved sales volumes in 2022 versus 2021.
Contract acquisition costs. Contract acquisition costs increased during 2022 compared to 2021 primarily due to the timing of the acquisition of e-TeleQuote on July 1, 2021. As a result, a full year of operations are included in 2022 compared to only six months in 2021. This increase was partially offset by lower costs in 2022 from reduced sales volumes as well as lower unit contract acquisition costs attributable to a number of factors including revised lead acquisition strategies, improved lead routing, and enhancements in agent training.
Goodwill impairment loss. Goodwill impairment loss reflects the non-cash goodwill impairment charge, which represents the excess of the Senior Health reporting unit’s carrying value over its estimated fair value.
Other operating expenses. Other operating expenses increased during 2022 compared to 2021 primarily due to the timing of the acquisition of e-TeleQuote on July 1, 2021. As a result, 2022 includes a full year of operations compared to only six months in 2021. Other operating expenses includes $11.0 million and $5.8 million of amortization expense for acquired intangible assets and internally developed software for 2022 and 2021, respectively.
Corporate and Other Distributed Products Segment. Our results of operations for the Corporate and Other Distributed Products segment for the years ended December 31, 2023, 2022, and 2021 were as follows:
|
|
Year ended December 31, |
|
|
2023 vs. 2022 change |
|
|
2022 vs. 2021 change |
|
|||||||||||||||||||
|
|
2023 |
|
|
2022 |
|
|
2021 |
|
|
$ |
|
|
% |
|
|
$ |
|
|
% |
|
|||||||
|
|
(Dollars in thousands) |
|
|||||||||||||||||||||||||
Revenues: |
|
|
|
|
|
|
|
|
|
|
|
|
|
|
|
|
|
|
|
|
|
|||||||
Direct premiums |
|
$ |
19,365 |
|
|
$ |
21,032 |
|
|
$ |
22,320 |
|
|
$ |
(1,667 |
) |
|
|
(8 |
)% |
|
$ |
(1,288 |
) |
|
|
(6 |
)% |
Ceded premiums |
|
|
(3,807 |
) |
|
|
(6,450 |
) |
|
|
(6,666 |
) |
|
|
(2,643 |
) |
|
|
(41 |
)% |
|
|
(216 |
) |
|
|
(3 |
)% |
Net Premiums |
|
|
15,558 |
|
|
|
14,582 |
|
|
|
15,654 |
|
|
|
976 |
|
|
|
7 |
% |
|
|
(1,072 |
) |
|
|
(7 |
)% |
Commissions and fees |
|
|
40,092 |
|
|
|
46,434 |
|
|
|
62,160 |
|
|
|
(6,342 |
) |
|
|
(14 |
)% |
|
|
(15,726 |
) |
|
|
(25 |
)% |
Investment income net of investment expenses |
|
|
201,311 |
|
|
|
156,987 |
|
|
|
142,795 |
|
|
|
44,324 |
|
|
|
28 |
% |
|
|
14,192 |
|
|
|
10 |
% |
Interest expense on surplus note |
|
|
(65,474 |
) |
|
|
(63,922 |
) |
|
|
(62,207 |
) |
|
|
1,552 |
|
|
|
2 |
% |
|
|
1,715 |
|
|
|
3 |
% |
Net investment income |
|
|
135,837 |
|
|
|
93,065 |
|
|
|
80,588 |
|
|
|
42,772 |
|
|
|
46 |
% |
|
|
12,477 |
|
|
|
15 |
% |
Realized investment gains (losses) |
|
|
(645 |
) |
|
|
1,444 |
|
|
|
4,665 |
|
|
|
(2,089 |
) |
|
* |
|
|
|
(3,221 |
) |
|
* |
|
||
Other investment gains (losses) |
|
|
(5,251 |
) |
|
|
(2,439 |
) |
|
|
1,207 |
|
|
|
(2,812 |
) |
|
* |
|
|
|
(3,646 |
) |
|
* |
|
||
Investment gains (losses) |
|
|
(5,896 |
) |
|
|
(995 |
) |
|
|
5,872 |
|
|
|
(4,901 |
) |
|
* |
|
|
|
(6,867 |
) |
|
* |
|
||
Other, net |
|
|
4,609 |
|
|
|
4,967 |
|
|
|
3,971 |
|
|
|
(358 |
) |
|
|
(7 |
)% |
|
|
996 |
|
|
|
25 |
% |
Total revenues |
|
|
190,200 |
|
|
|
158,053 |
|
|
|
168,245 |
|
|
|
32,147 |
|
|
|
20 |
% |
|
|
(10,192 |
) |
|
|
(6 |
)% |
Benefits and expenses: |
|
|
|
|
|
|
|
|
|
|
|
|
|
|
|
|
|
|
|
|
|
|||||||
Benefits and claims |
|
|
20,895 |
|
|
|
12,406 |
|
|
|
12,049 |
|
|
|
8,489 |
|
|
|
68 |
% |
|
|
357 |
|
|
|
3 |
% |
Future policy benefits remeasurement (gain) loss |
|
|
(171 |
) |
|
|
1,072 |
|
|
|
386 |
|
|
|
(1,243 |
) |
|
* |
|
|
|
686 |
|
|
* |
|
||
Amortization of DAC |
|
|
1,534 |
|
|
|
1,173 |
|
|
|
1,379 |
|
|
|
361 |
|
|
|
31 |
% |
|
|
(206 |
) |
|
|
(15 |
)% |
Insurance expenses |
|
|
5,070 |
|
|
|
4,609 |
|
|
|
5,343 |
|
|
|
461 |
|
|
|
10 |
% |
|
|
(734 |
) |
|
|
(14 |
)% |
Insurance commissions |
|
|
1,260 |
|
|
|
1,092 |
|
|
|
1,171 |
|
|
|
168 |
|
|
|
15 |
% |
|
|
(79 |
) |
|
|
(7 |
)% |
Sales commissions |
|
|
18,420 |
|
|
|
21,215 |
|
|
|
28,748 |
|
|
|
(2,795 |
) |
|
|
(13 |
)% |
|
|
(7,533 |
) |
|
|
(26 |
)% |
Interest expense |
|
|
26,594 |
|
|
|
27,237 |
|
|
|
30,618 |
|
|
|
(643 |
) |
|
|
(2 |
)% |
|
|
(3,381 |
) |
|
|
(11 |
)% |
Loss on extinguishment of debt |
|
|
- |
|
|
|
- |
|
|
|
8,927 |
|
|
|
- |
|
|
* |
|
|
|
(8,927 |
) |
|
* |
|
||
Other operating expenses |
|
|
139,850 |
|
|
|
130,892 |
|
|
|
130,019 |
|
|
|
8,958 |
|
|
|
7 |
% |
|
|
873 |
|
|
* |
|
|
Total benefits and expenses |
|
|
213,452 |
|
|
|
199,696 |
|
|
|
218,640 |
|
|
|
13,756 |
|
|
|
7 |
% |
|
|
(18,944 |
) |
|
|
(9 |
)% |
Loss before income taxes |
|
$ |
(23,252 |
) |
|
$ |
(41,643 |
) |
|
$ |
(50,395 |
) |
|
$ |
(18,391 |
) |
|
|
(44 |
)% |
|
$ |
(8,752 |
) |
|
|
(17 |
)% |
* Less than 1% or not meaningful
2023 compared to 2022
Total revenues. Total revenues increased in 2023 from 2022 primarily due to higher net investment income. Net investment income increased due to the factors described in “Primerica, Inc. and Subsidiaries Results” above. This increase was partially offset by a year-over-year decline in revenue from commissions and fees and investment gains (losses). Commissions and fees revenue earned from our mortgage distribution product offerings were lower during 2023 compared to 2022 primarily attributable to higher mortgage
68
interest rates that reduced demand for mortgage products. The change in investment gains (losses) is discussed in the “Primerica, Inc. and Subsidiaries Results” section above.
Total Benefits and Expenses. Total benefits and expenses increased in 2023 from 2022 due to higher benefits and claims and other operating expenses. The increase in benefits and claims was primarily due to two factors that occurred during 2023. The first item was the recognition of a credit loss for the remaining ceded reserves on a closed block of non-term life insurance business from an insolvent reinsurer that was liquidated. The second item was an adjustment to the estimated portion of ceded claims to be recovered in excess of premiums ceded for a closed block of non-term life insurance. The increase in other operating expenses in 2023 versus 2022 was primarily driven by higher employee-related costs, technology, and legal expenses. Partially offsetting these increases was the decrease in sales commissions for 2023 compared to 2022 that was in line with the decrease in commissions and fees revenue from our mortgage distribution product offerings.
2022 compared to 2021
Total revenues. Total revenues decreased in 2022 from 2021 primarily due to lower commissions and fees from our mortgage distribution business as a result of rising interest rates, as well as a decrease in investment gains (losses), partially offset by an increase in net investment income. The change in investment gains (losses) and net investment income are discussed in “Primerica, Inc. and Subsidiaries Results” above.
Total Benefits and Expenses. Total benefits and expenses decreased in 2022 from 2021 due to lower sales commissions from our mortgage distribution business, the loss on extinguishment of debt in 2021 as a result of the accelerated repayment of senior notes in 2021 scheduled to mature in 2022, and lower interest expense. Interest expense in 2021 was higher than 2022 as a result of borrowings on the Revolving Credit Facility to fund the e-TeleQuote acquisition and an overlap of interest obligations due to the issuance of the Senior Notes in November 2021 before the early extinguishment of our previous senior notes.
Financial Condition
Investments. Our insurance business is primarily focused on selling term life insurance, which does not include an investment component for the policyholder. The invested asset portfolio funded by premiums from our term life insurance business does not involve the substantial asset accumulations and spread requirements that exist with other non-term life insurance products. As a result, the profitability of our term life insurance business is not as sensitive to the impact that interest rates have on our invested asset portfolio and investment income as the profitability of other companies that distribute non-term life insurance products.
We follow a conservative investment strategy designed to emphasize the preservation of our invested assets and provide adequate liquidity for the prompt payment of claims. To meet business needs and mitigate risks, our investment guidelines provide restrictions on our portfolio’s composition, including limits on asset type, per issuer limits, credit quality limits, portfolio duration, limits on the amount of investments in approved countries and permissible security types. We also manage and monitor our allocation of investments to limit the accumulation of any disproportionate concentrations of risk among industry sectors or issuer countries outside of the U.S. and Canada. In addition, as of December 31, 2023, we did not hold any country of issuer concentrations outside of the U.S. or Canada that represented more than 5% of the fair value of our available-for-sale invested asset portfolio or any industry concentrations of corporate bonds that represented more than 10% of the fair value of our available-for-sale invested asset portfolio.
We invest a portion of our portfolio in assets denominated in Canadian dollars to support our Canadian operations. Additionally, to ensure adequate liquidity for payment of claims, we take into account the maturity and duration of our invested asset portfolio and our general liability profile.
We also hold within our invested asset portfolio a credit enhanced note (“LLC Note”) issued by a limited liability company owned by a third-party service provider which is classified as a held-to-maturity security. The LLC Note, which is scheduled to mature on December 31, 2030, was obtained in exchange for the Surplus Note of equal principal amount issued by Vidalia Re, a special purpose financial captive insurance company and wholly owned subsidiary of Primerica Life Insurance Company (“Primerica Life”). For more information on the LLC Note, see Note 4 (Investments) to our consolidated financial statements included elsewhere in this report.
We have an investment committee composed of members of our senior management team that is responsible for establishing and maintaining our investment guidelines and supervising our investment activity. Our investment committee regularly monitors our overall investment results and our compliance with our investment objectives and guidelines. We use a third-party investment advisor to assist us in the management of our investing activities. Our investment advisor reports to our investment committee.
Our invested asset portfolio is subject to a variety of risks, including risks related to general economic conditions, market volatility, interest rate fluctuations, liquidity risk and credit and default risk. Investment guideline restrictions have been established to minimize the effect of these risks but may not always be effective due to factors beyond our control. Interest rates and credit spreads are highly sensitive to many factors, including governmental monetary policies, domestic and international economic and political conditions and other factors beyond our control. A significant increase in interest rates or credit spreads could result in significant unrealized losses in
69
the value of our invested asset portfolio. For example, the increase in interest rates during the first three quarters of 2023 resulted in the fair value of the invested asset portfolio declining, with a subsequent increase in fair value as interest rates declined and credit spreads tightened during the fourth quarter of 2023. As of December 31, 2023, unrealized losses were $215.7 million compared to an unrealized loss of $305.9 million as of December 31, 2022. We believe that fluctuations caused by movement in interest rates and credit spreads generally have little bearing on the recoverability of our investments as we have the ability to hold these investments until maturity or a market price recovery and we have no present intention to dispose of them.
Details on asset mix (excluding our held-to-maturity security) were as follows:
|
|
December 31, 2023 |
|
December 31, 2022 |
||||
|
|
Fair value |
|
Cost or amortized cost |
|
Fair value |
|
Cost or amortized cost |
U.S. government and agencies |
|
0% |
|
0% |
|
1% |
|
1% |
Foreign government |
|
5% |
|
5% |
|
5% |
|
5% |
States and political subdivisions |
|
4% |
|
4% |
|
4% |
|
4% |
Corporates |
|
48% |
|
48% |
|
48% |
|
49% |
Mortgage- and asset-backed securities |
|
23% |
|
24% |
|
22% |
|
23% |
Short-term investments |
|
0% |
|
0% |
|
2% |
|
2% |
Equity securities |
|
1% |
|
1% |
|
1% |
|
1% |
Trading securities |
|
1% |
|
1% |
|
1% |
|
1% |
Cash and cash equivalents |
|
18% |
|
17% |
|
16% |
|
14% |
Total |
|
100% |
|
100% |
|
100% |
|
100% |
The composition and duration of our portfolio will vary depending on several factors, including the yield curve and our opinion of the relative value among various asset classes. The proportion of the invested asset portfolio invested in short-term investments decreased and the proportion invested in cash and cash equivalents and mortgage- and asset-backed securities increased from 2022 to 2023 as a result of our view of the relative value between those asset classes. The year-end average rating, duration and book yield of our fixed-maturity portfolio (excluding our held-to-maturity security) were as follows:
|
|
December 31, 2023 |
|
December 31, 2022 |
Average rating of our fixed-maturity portfolio |
|
A |
|
A |
Average duration of our fixed-maturity portfolio |
|
4.7 years |
|
4.7 years |
Average book yield of our fixed-maturity portfolio |
|
3.83% |
|
3.44% |
The increase in the average book yield of our fixed-maturity portfolio as of December 31, 2023 reflects higher reinvestment rates compared to the yield on maturing investments during 2023.
Ratings for our investments in fixed-maturity securities are determined using Nationally Recognized Statistical Rating Organizations designations and/or equivalent ratings. The distribution of our investments in fixed-maturity securities (excluding our held-to-maturity security) by rating, including those classified as trading securities, were as follows:
|
|
December 31, 2023 |
|
|
December 31, 2022 |
|
||||||||||
|
|
Amortized cost (1) |
|
|
% |
|
|
Amortized cost (1) |
|
|
% |
|
||||
|
|
(Dollars in thousands) |
|
|||||||||||||
AAA |
|
$ |
556,936 |
|
|
|
19 |
% |
|
$ |
606,982 |
|
|
|
22 |
% |
AA |
|
|
439,814 |
|
|
|
15 |
% |
|
|
321,450 |
|
|
|
11 |
% |
A |
|
|
735,647 |
|
|
|
25 |
% |
|
|
688,936 |
|
|
|
25 |
% |
BBB |
|
|
1,162,279 |
|
|
|
39 |
% |
|
|
1,120,096 |
|
|
|
40 |
% |
Below investment grade |
|
|
58,221 |
|
|
|
2 |
% |
|
|
67,450 |
|
|
|
2 |
% |
Not rated |
|
|
698 |
|
|
* |
|
|
|
199 |
|
|
* |
|
||
Total |
|
$ |
2,953,595 |
|
|
|
100 |
% |
|
$ |
2,805,113 |
|
|
|
100 |
% |
* Less than 1%.
70
The ten largest holdings within our fixed-maturity securities invested asset portfolio (excluding our held-to-maturity security and short-term investments) were as follows:
|
|
December 31, 2023 |
||||||||||||
Issuer |
|
Fair value |
|
|
Amortized cost (1) |
|
|
Unrealized gain (loss) |
|
|
Credit rating |
|||
|
|
(Dollars in thousands) |
||||||||||||
Government of Canada |
|
$ |
19,546 |
|
|
$ |
20,310 |
|
|
$ |
(764 |
) |
|
AAA |
Province of Alberta Canada |
|
|
15,569 |
|
|
|
16,231 |
|
|
|
(662 |
) |
|
AA- |
Province of Quebec Canada |
|
|
15,367 |
|
|
|
15,649 |
|
|
|
(282 |
) |
|
AA- |
Wells Fargo & Co |
|
|
14,922 |
|
|
|
14,881 |
|
|
|
41 |
|
|
BBB+ |
Province of Ontario Canada |
|
|
14,610 |
|
|
|
14,850 |
|
|
|
(240 |
) |
|
A+ |
Bank of America Corp |
|
|
13,258 |
|
|
|
13,382 |
|
|
|
(124 |
) |
|
A- |
Ontario Teachers' Pension Plan |
|
|
13,182 |
|
|
|
14,449 |
|
|
|
(1,267 |
) |
|
AA+ |
ONEOK Inc |
|
|
12,257 |
|
|
|
12,399 |
|
|
|
(142 |
) |
|
BBB |
Boeing Co |
|
|
12,211 |
|
|
|
11,835 |
|
|
|
376 |
|
|
BBB- |
Manulife Financial Corp |
|
|
11,148 |
|
|
|
11,708 |
|
|
|
(560 |
) |
|
A |
Total – ten largest holdings |
|
$ |
142,070 |
|
|
$ |
145,694 |
|
|
$ |
(3,624 |
) |
|
|
Total – fixed-maturity securities |
|
$ |
2,737,850 |
|
|
$ |
2,953,595 |
|
|
|
|
|
|
|
Percent of total fixed-maturity securities |
|
|
5 |
% |
|
|
5 |
% |
|
|
|
|
|
|
For additional information on our invested asset portfolio, see Note 4 (Investments) and Note 5 (Fair Value of Financial Instruments) to our consolidated financial statements included elsewhere in this report.
Other Significant Assets and Liabilities. The balances of and changes in other significant assets and liabilities were as follows:
|
|
December 31, |
|
|
Change |
|
||||||||||
|
|
2023 |
|
|
2022 |
|
|
$ |
|
|
% |
|
||||
|
|
(Dollars in thousands) |
|
|||||||||||||
Assets: |
|
|
|
|
|
|
|
|
|
|
|
|
||||
Reinsurance recoverables |
|
$ |
3,015,777 |
|
|
$ |
3,209,540 |
|
|
$ |
(193,763 |
) |
|
|
(6 |
)% |
Deferred policy acquisition costs, net |
|
|
3,447,234 |
|
|
|
3,188,502 |
|
|
|
258,732 |
|
|
|
8 |
% |
Liabilities: |
|
|
|
|
|
|
|
|
|
|
|
|
||||
Future policy benefits |
|
$ |
6,742,025 |
|
|
$ |
6,297,906 |
|
|
$ |
444,119 |
|
|
|
7 |
% |
Reinsurance recoverables. Reinsurance recoverables reflects future policy benefit reserves and claim reserves ceded to reinsurers, including the IPO coinsurers. Reinsurance recoverables as of December 31, 2023 decreased compared with December 31, 2022 primarily due to the continued runoff of the IPO book of business.
Deferred policy acquisition costs, net. The increase in DAC was primarily a result of the cumulative impact of incremental commissions and expenses deferred as a result of new business in 2023 not subject to the IPO coinsurance agreements.
Future policy benefits. The increase in future policy benefits was mostly a result of continued growth in our in-force book of business. Also contributing to the year-over-year increase in future policy benefits is the decrease in market observable interest rates at year-end that are used to discount the present value of the estimated future cash flows included in the liability for future policy benefits.
For additional information, see the notes to our consolidated financial statements included elsewhere in this report.
Liquidity and Capital Resources
Dividends and other payments to the Parent Company from its subsidiaries are our principal sources of cash. The amount of dividends paid by the subsidiaries is dependent on their capital needs to fund future growth and applicable regulatory restrictions. The primary uses of funds by the Parent Company include the payments of stockholder dividends, interest on notes payable, general operating expenses, and income taxes, as well as repurchases of shares of our common stock outstanding. During 2023, our life insurance underwriting companies declared and paid ordinary dividends of $352.3 million to the Parent Company. See Note 16 (Statutory Accounting and Dividend Restrictions) to our consolidated financial statements included elsewhere in this report for more information on insurance subsidiary dividends and statutory restrictions. In addition, in 2023 our non-life insurance subsidiaries declared and paid dividends of $203.2 million to the Parent Company. At December 31, 2023, the Parent Company had cash and invested assets of $381.9 million.
71
The Parent Company’s subsidiaries generate operating cash flows primarily from term life insurance premiums (net of premiums ceded to reinsurers), income from invested assets, commissions and fees collected from the distribution of investment and savings products, Medicare-related insurance plans as well as other financial products. The subsidiaries’ principal operating cash outflows include the payment of insurance claims and benefits (net of ceded claims recovered from reinsurers), commissions to the sales force, contract acquisition costs, insurance and other operating expenses, interest expense for future policy benefit reserves financing transactions, and income taxes.
The distribution and underwriting of term life insurance requires up-front cash outlays at the time the policy is issued as we pay a substantial majority of the sales commission during the first year following the sale of a policy and incur costs for underwriting activities at the inception of a policy’s term. During the early years of a policy’s term, we generally receive level term premiums in excess of claims paid. We invest the excess cash generated during earlier policy years in fixed-maturity and equity securities held in support of future policy benefit reserves. In later policy years, cash received from the maturity or sale of invested assets is used to pay claims in excess of level term premiums received.
e-TeleQuote is a senior health insurance distributor of Medicare-related insurance plans. e-TeleQuote collects cash receipts over a number of years after selling a plan, while the cash outflow for commission expense and other acquisition costs to sell the plans are generally recognized at the time of enrollment. Therefore, in periods of growth, net cash flows at e-TeleQuote are expected to be negative, which may require the Parent Company to provide working capital to e-TeleQuote. During the year ended December 31, 2023, e-TeleQuote generated sufficient cash from operations to fund its operating needs.
Historically, cash flows generated by our businesses, primarily from our existing block of term life policies and our investment and savings products, have provided us with sufficient liquidity to meet our operating requirements. We anticipate that cash flows from our businesses will continue to provide sufficient operating liquidity over the next 12 months.
If necessary, we could seek to enhance our liquidity position or capital structure through sales of our available-for-sale investment portfolio, changes in the timing or amount of share repurchases, borrowings against our Revolving Credit Facility, or some combination of these sources. Additionally, we believe that cash flows from our businesses and potential sources of funding will sufficiently support our long-term liquidity needs.
Cash Flows. The components of the changes in cash and cash equivalents were as follows:
|
|
Year ended December 31, |
|
|||||||||
|
|
2023 |
|
|
2022 |
|
|
2021 |
|
|||
|
|
(In thousands) |
|
|||||||||
Net cash provided by (used in) operating activities |
|
$ |
692,517 |
|
|
$ |
757,665 |
|
|
$ |
656,956 |
|
Net cash provided by (used in) investing activities |
|
|
(90,051 |
) |
|
|
(200,048 |
) |
|
|
(923,383 |
) |
Net cash provided by (used in) financing activities |
|
|
(479,621 |
) |
|
|
(457,850 |
) |
|
|
107,974 |
|
Effect of foreign exchange rate changes on cash |
|
|
1,063 |
|
|
|
(3,028 |
) |
|
|
3,385 |
|
Change in cash and cash equivalents |
|
$ |
123,908 |
|
|
$ |
96,739 |
|
|
$ |
(155,068 |
) |
Operating Activities. Cash provided by operating activities decreased in 2023 from 2022. The largest factor contributing to the decrease in cash provided by operating activities in 2023 compared to 2022 was the timing of cash payments received from reinsurers in the prior year. At the beginning of 2022, there was a large balance of ceded claims due from reinsurers from claims paid during the height of the COVID-19 pandemic, which were collected during 2022. Also contributing to the decrease were timing differences of purchases and maturities of trading securities as well as timing of cash disbursements for accounts payable and claims checks.
Cash provided by operating activities increased in 2022 from 2021. Although net income decreased slightly during 2022, cash generated from operating activities increased as it excludes non-cash charges such as amortization of deferred policy acquisition costs, goodwill impairments and renewal commissions tail adjustments. The timing of cash receipts for ceded claims due at the beginning of 2022 as discussed above drove the increase in cash provided by operating activities in 2022 versus 2021. Also contributing to the year-over-year increase in cash provided by operating activities were lower cash outlays for deferred acquisition costs due to lower term life policy sales.
Investing Activities. Cash used in investing activities decreased in 2023 from 2022 primarily due to fluctuations in the timing of maturities and reinvestment of debt securities held in our available-for-sale investment portfolio. In both periods, cash provided by operating activities was used to fund investment purchases that increased the size of our invested asset portfolio.
Cash used in investing activities decreased in 2022 from 2021 primarily due to funding the acquisition of e-TeleQuote on July 1, 2021. Also contributing to the decrease were lower purchases of securities in the invested assets portfolio. In 2021, purchases of securities were higher as the Company deployed the net cash received from the issuance of the Senior Notes.
Financing Activities. Cash used in financing activities increased in 2023 from 2022 primarily due to an increase in dividends paid per share and an increase in our share repurchase program.
72
Financing activities was a use of cash during 2022 compared to a source of cash during 2021. This movement is primarily due to cash used to fund share repurchases during 2022. By comparison, the Company paused share repurchases during 2021 to accumulate cash to fund the acquisition of e-TeleQuote. In addition, during 2021 cash provided by financing activities included cash received from the issuance of the Senior Notes partially offset by the early extinguishment of our previous senior notes that were scheduled to mature in 2022.
Risk-Based Capital (“RBC”). The National Association of Insurance Commissioners (“NAIC”) has established RBC standards for U.S. life insurers, as well as a risk-based capital model act (the “RBC Model Act”) that has been adopted by the insurance regulatory authorities. The RBC Model Act requires that life insurers annually submit a report to state regulators regarding their RBC based upon four categories of risk: asset risk, insurance risk, interest rate risk and business risk. The capital requirement for each is determined by applying factors that vary based upon the degree of risk to various asset, premiums and policy benefit reserve items. The formula is an early warning tool to identify possible weakly capitalized companies for purposes of initiating further regulatory action.
As of December 31, 2023, our U.S. life insurance subsidiaries maintained statutory capital and surplus substantially in excess of the applicable regulatory requirements and remain well positioned to support existing operations and fund future growth.
In Canada, an insurer’s minimum capital requirement is overseen by the Office of the Superintendent of Financial Institutions (“OSFI”) and determined as the sum of the capital requirements for six categories of risk: asset default risk, mortality/morbidity/lapse/expense risks, changes in interest rate environment risk, operational risk, segregated funds risk and foreign exchange risk. As of December 31, 2023, Primerica Life Insurance Company of Canada was in compliance with Canada’s minimum capital requirements as defined by OSFI.
For more information regarding statutory capital requirements and dividend capacities of our insurance subsidiaries, see Note 16 (Statutory Accounting and Dividend Restrictions) to our consolidated financial statements included elsewhere in this report.
Redundant Reserve Financings. The Model Regulation entitled Valuation of Life Insurance Policies, commonly known as Regulation XXX, requires insurers to carry statutory policy benefit reserves for term life insurance policies with long-term premium guarantees which are often significantly in excess of the future policy benefit reserves that insurers deem necessary to satisfy claim obligations (“redundant policy benefit reserves”). Accordingly, many insurance companies have sought ways to reduce their capital needs by financing redundant policy benefit reserves through bank financing, reinsurance arrangements and other financing transactions.
We have established Peach Re, Inc. ("Peach Re") and Vidalia Re as special purpose financial captive insurance companies and wholly owned subsidiaries of Primerica Life. Primerica Life has ceded certain term life policies issued prior to 2011 to Peach Re as part of a Regulation XXX redundant reserve financing transaction (the “Peach Re Redundant Reserve Financing Transaction”) and has ceded certain term life policies issued in 2011 through 2017 to Vidalia Re as part of a Regulation XXX redundant reserve financing transaction (the “Vidalia Re Redundant Reserve Financing Transaction”). These redundant reserve financing transactions allow us to more efficiently manage and deploy our capital. The Peach Re Redundant Reserve Financing Transaction was approaching the end of its scheduled term in 2025, and effective January 2, 2024, Primerica Life recaptured the block of business reinsured by Peach Re and exercised its right to terminate the Peach Re Redundant Reserve Financing Transaction without an early termination penalty. See Note 16 (Statutory Accounting and Dividend Restrictions) and Note 17 (Commitments and Contingent Liabilities) to our consolidated financial statements included elsewhere in this report for more information.
The NAIC has adopted a model regulation for determining reserves using a principle-based approach (“principle-based reserves” or “PBR”), which is designed to reflect each insurer’s own experience in calculating reserves and move away from a single prescriptive reserving formula. Primerica Life adopted PBR as of January 1, 2018 and NBLIC adopted the New York amended version of PBR effective January 1, 2021. PBR significantly reduced the redundant statutory policy benefit reserve requirements while still ensuring adequate liabilities are held. The regulation only applies for business issued after the effective dates. See Note 4 (Investments), Note 11 (Debt) and Note 17 (Commitments and Contingent Liabilities) to our consolidated financial statements included elsewhere in this report for more information on these redundant reserve financing transactions.
Notes Payable – Long Term. The Company has $600.0 million of publicly-traded Senior Notes outstanding issued at a price of 99.55% with an annual interest rate of 2.80%, payable semi-annually in arrears on May 19 and November 19. The Senior Notes are scheduled to mature on November 19, 2031. We were in compliance with the covenants of the Senior Notes at December 31, 2023. No events of default occurred on the Senior Notes during the year ended December 31, 2023.
Financial Ratings. As of December 31, 2023, the investment grade credit ratings for our Senior Notes were as follows:
Agency |
|
Senior Notes rating |
Moody's |
|
Baa1, stable outlook |
Standard & Poor's |
|
A-, stable outlook |
A.M. Best Company |
|
a-, stable outlook |
73
As of December 31, 2023, Primerica Life’s financial strength ratings were as follows:
Agency |
|
Financial strength rating |
Moody's |
|
A1, stable outlook |
Standard & Poor's |
|
AA-, stable outlook |
A.M. Best Company |
|
A+, stable outlook |
Securities Lending. We participate in securities lending transactions with brokers to increase investment income with minimal risk. See Note 4 (Investments) to our consolidated financial statements included elsewhere in this report for additional information.
Surplus Note. Vidalia Re issued a Surplus Note in exchange for the LLC Note as a part of the Vidalia Re Redundant Reserve Financing Transaction. The Surplus Note has a principal amount equal to the LLC Note and is scheduled to mature on December 31, 2030. For more information on the Surplus Note, see Note 11 (Debt) to our consolidated financial statements included elsewhere in this report.
Off-Balance Sheet Arrangements. We have no transactions, agreements or other contractual arrangements to which an entity unconsolidated with the Company is a party, under which the Company maintains any off-balance sheet obligations or guarantees as of December 31, 2023.
Credit Facility Agreement. We maintain an unsecured $200.0 million Revolving Credit Facility with a syndicate of commercial banks that has a scheduled termination date of June 22, 2026. Amounts outstanding under the Revolving Credit Facility bear interest at a periodic rate equal to the Secured Overnight Financing Rate (“SOFR”) rate loan or the base rate, plus in either case an applicable margin. The Revolving Credit Facility contains language that allows for the Company and the lenders to agree on a comparable or successor reference rate in the event SOFR is no longer available. The Revolving Credit Facility also permits the issuance of letters of credit. The applicable margins are based on our debt rating with such margins for SOFR rate loans and letters of credit ranging from 1.000% to 1.625% per annum and for base rate loans ranging from 0.000% to 0.625% per annum. Under the Revolving Credit Facility, we incur a commitment fee that is payable quarterly in arrears and is determined by our debt rating. This commitment fee ranges from 0.100% to 0.225% per annum of the aggregate $200.0 million commitment of the lenders under the Revolving Credit Facility. As of December 31, 2023, no amounts were outstanding under the Revolving Credit Facility and we were in compliance with its covenants. Furthermore, no events of default occurred under the Revolving Credit Facility in 2023.
Contractual Obligations. Our material cash requirements from known contractual and other obligations primarily consist of following:
Future Policy Benefits. Our liability for future policy benefits, which is presented in the consolidated balance sheets, represents the present value of expected future net premiums receivable under the contracts. Net premiums are defined as the portion of the gross premiums received from policyholders that are needed to pay for all benefits. These benefit payments are contingent on policyholders continuing to renew their policies and make their premium payments. We expect to fully fund the obligations for future policy benefits from cash flows from general account invested assets, claims reimbursed by reinsurers, and from future premiums.
Policy Claims. Policy claims, which is presented in the consolidated balance sheets and Note 9 (Policy Claims and Other Benefits Payable) to our consolidated financial statements included elsewhere in this report, represents claims and benefits that have been incurred but not paid to policyholders and are assumed to be due within a year.
Other Policyholder Funds. Other policyholder funds, which is presented in the consolidated balance sheets, primarily represent claim payments left on deposit with us that are payable on demand.
Notes Payable and Interest Obligations. We have debt obligations for the principal balance of our Senior Notes, which is presented in the consolidated balance sheets and described further in Note 11 (Debt) to our consolidated financial statements included elsewhere in the report. We also maintain interest obligations for interest on our Senior Notes, the commitment fee on our Revolving Credit Facility, the financing charges related to an issued letter of credit, fees paid for the credit enhancement feature on the LLC Note and a finance charge incurred pursuant to one of our IPO coinsurance agreements as of December 31, 2023. We did not expect the principal or interest on the Surplus Note will result in any cash requirements as the payments due for these items are contractually offset by the principal and interest on the LLC Note as long as we hold the LLC Note. The Company asserts its positive intent and ability to hold the LLC Note until maturity.
Lease Obligations. Our lease obligations primarily represent payments for operating leases related to office space. For additional information on leases see Note 20 (Leases) to our consolidated financial statements included elsewhere in this report.
For additional information concerning our commitments and contingencies, see Note 17 (Commitments and Contingent Liabilities) to our consolidated financial statements included elsewhere in this report.
74
ITEM 7A. QUANTITATIVE AND QUALITATIVE DISCLOSURES ABOUT MARKET RISK.
Market risk is the risk of the loss of fair value resulting from adverse changes in market rates and prices, such as interest rates and foreign currency exchange rates. Market risk is directly influenced by the volatility and liquidity in the markets in which the related underlying financial instruments are traded. Sensitivity analysis measures the impact of hypothetical changes in interest rates, foreign exchange rates and other market rates or prices on the profitability of market-sensitive financial instruments.
The following discussion about the potential effects of changes in interest rates and Canadian currency exchange rates is based on shock-tests, which model the effects of interest rate and Canadian exchange rate shifts on our financial condition and results of operations. Although we believe shock tests provide the most meaningful analysis permitted by the rules and regulations of the SEC, they are constrained by several factors, including the necessity to conduct the analysis based on a single point in time and by their inability to include the extraordinarily complex market reactions that normally would arise from the market shifts modeled. Although the following results of shock tests for changes in interest rates and Canadian currency exchange rates may have some limited use as benchmarks, they should not be viewed as forecasts. These disclosures also are selective in nature and address, in the case of interest rates, only the potential direct impact on our financial instruments and, in the case of Canadian currency exchange rates, the potential translation impact on net income from our Canadian subsidiaries. They do not include a variety of other potential factors that could affect our business as a result of these changes in interest rates and Canadian currency exchange rates.
Interest Rate Risk. The fair value of the fixed-maturity securities (excluding the held-to-maturity security) in our invested asset portfolio as of December 31, 2023 and 2022 was $2.7 billion and $2.5 billion, respectively. One of the primary market risks for this portion of our invested asset portfolio is interest rate risk. One means of assessing the exposure of our fixed-maturity securities portfolios to interest rate changes is a duration-based analysis that measures the potential changes in market value resulting from a hypothetical change in interest rates of 100 basis points across all maturities. This model is sometimes referred to as a parallel shift in the yield curve. Under this model, with all other factors constant and assuming no offsetting change in the value of our liabilities, we estimated that such an increase in interest rates would cause the fair value of our fixed-maturity securities portfolios to decline by $111.8 million, or 4%, based on our actual securities positions as of December 31, 2023. For comparative purposes, the same increase in rates would have caused the fair value of our fixed-maturity securities portfolios to decline by $105.1 million, or 4%, based on our actual securities positions as of December 31, 2022.
Canadian Currency Risk. We also have exposure to foreign currency exchange risk to the extent we conduct business in Canada. A strong Canadian dollar relative to the U.S. dollar results in higher levels of reported revenues, expenses, net income, assets, liabilities, and accumulated comprehensive income (loss) in our U.S. dollar financial statements, and a weaker Canadian dollar would have the opposite effect. Generally, our Canadian dollar-denominated assets are held in support of our Canadian dollar-denominated liabilities. For the year ended December 31, 2023, 12% of our revenues from operations, excluding realized investment gains, and 14% of income before income taxes were generated by our Canadian operations. For the year ended December 31, 2022, 13% of our revenues from operations, excluding realized investment gains, and 18% of income before income taxes were generated by our Canadian operations.
One means of assessing exposure to changes in Canadian currency exchange rates is to model the effects on reported income using a sensitivity analysis. We analyzed our Canadian currency exposure for the year ended December 31, 2023. Net exposure was measured assuming a 10% decrease in the value of the Canadian dollar relative to the U.S. dollar. We estimated that such a decrease would decrease our income before income taxes for the year ended December 31, 2023 by $10.5 million.
Our investment in the net assets of our Canadian operations is also subject to Canadian currency risk. If we were to assume a 10% decrease in Canadian currency exchange rates compared to the U.S. dollar, the translated value of our net investment in our Canadian subsidiaries in U.S. dollars would decrease by $32.9 million based on net assets as of December 31, 2023. For comparative purposes, a similar decrease in Canadian currency exchange rates compared to the U.S. dollar would have caused the translated value of our net investment in our Canadian subsidiaries in U.S. dollars to decline by $30.1 million based on net assets as of December 31, 2022. Historically, we have not hedged this exposure, although we may elect to do so in future periods. The impact of translating the balance of net assets of our Canadian operations is recorded in our consolidated balance sheets within the accumulated other comprehensive income component of stockholders’ equity.
75
Credit Risk. We extensively use reinsurance in the United States to diversify our insurance and underwriting risk and to manage our loss exposure to mortality risk. Reinsurance does not relieve us of our direct liability to our policyholders. Due to factors such as insolvency, adverse underwriting results or inadequate investment returns, our reinsurers may not be able to pay the amounts they owe us on a timely basis or at all. Further, reinsurers might refuse or fail to pay losses that we cede to them or might delay payment. To limit our exposure with any one reinsurer, we monitor the concentration of credit risk we have with our reinsurance counterparties, as well as their financial condition. We manage this reinsurer credit risk through analysis and monitoring of the credit-worthiness of each of our reinsurance partners to minimize collection issues. Also, for reinsurance contracts with unauthorized reinsurers, we require collateral such as letters of credit. For information on our reinsurance exposure and reinsurers, see Note 6 (Reinsurance) to our consolidated financial statements included elsewhere in this report.
Concurrent with the execution of the Vidalia Re Redundant Reserve Financing Transaction between Vidalia Re and Primerica Life, Vidalia Re entered into a Surplus Note Purchase Agreement (the “Surplus Note Purchase Agreement”) with Hannover Life Reassurance Company of America and certain of its affiliates (collectively, “Hannover Re”) and a newly-formed limited liability company (the “LLC”) owned by a third-party service provider. Under the Surplus Note Purchase Agreement, Vidalia Re issued the Surplus Note to the LLC in exchange for the LLC Note of equal principal amount. The Company assumes credit risk associated with a credit enhancement feature provided by Hannover Re, which bears the obligation to absorb the LLC’s losses in the event of a Surplus Note default in exchange for a fee.
For information on the Surplus Note Purchase Agreement, see Note 4 (Investments) and Note 11 (Debt) to our consolidated financial statements included elsewhere in this report.
We also bear credit risk on our investment portfolio related to the uncertainty associated with the continued ability of an obligor to make timely payments of principal and interest. In an effort to meet business needs and mitigate credit and other portfolio risks, we established investment guidelines that provide restrictions on our portfolio’s composition, including limits on asset type, per issuer limits, credit quality limits, portfolio duration, limits on the amount of investments in approved countries and permissible security types. See “Item 7. Management’s Discussion and Analysis of Financial Condition and Results of Operations – Financial Condition” for details on our investment portfolio, including investment strategy, asset mix and credit ratings.
76
ITEM 8. FINANCIAL STATEMENTS AND SUPPLEMENTARY DATA.
Report of Independent Registered Public Accounting Firm
To the Stockholders and Board of Directors
Primerica, Inc.:
Opinion on the Consolidated Financial Statements
We have audited the accompanying consolidated balance sheets of Primerica, Inc. and subsidiaries (the Company) as of December 31, 2023 and 2022, the related consolidated statements of income, comprehensive income, stockholders’ equity, and cash flows for each of the years in the three-year period ended December 31, 2023, and the related notes and financial statement schedules I, II, III and IV (collectively, the consolidated financial statements). In our opinion, the consolidated financial statements present fairly, in all material respects, the financial position of the Company as of December 31, 2023 and 2022, and the results of its operations and its cash flows for each of the years in the three-year period ended December 31, 2023, in conformity with U.S. generally accepted accounting principles.
We also have audited, in accordance with the standards of the Public Company Accounting Oversight Board (United States) (PCAOB), the Company’s internal control over financial reporting as of December 31, 2023, based on criteria established in Internal Control – Integrated Framework (2013) issued by the Committee of Sponsoring Organizations of the Treadway Commission, and our report dated February 28, 2024 expressed an unqualified opinion on the effectiveness of the Company’s internal control over financial reporting.
Change in Accounting Principle
As discussed in Note 1 to the consolidated financial statements, the Company adopted the FASB issued Accounting Standards Update No. 2018-12, Financial Services—Insurance (Topic 944) — Targeted Improvements to the Accounting for Long-Duration Contracts (“ASU 2018-12” or “LDTI”), effective January 1, 2023, with a transition date of January 1, 2021.
Basis for Opinion
These consolidated financial statements are the responsibility of the Company’s management. Our responsibility is to express an opinion on these consolidated financial statements based on our audits. We are a public accounting firm registered with the PCAOB and are required to be independent with respect to the Company in accordance with the U.S. federal securities laws and the applicable rules and regulations of the Securities and Exchange Commission and the PCAOB.
We conducted our audits in accordance with the standards of the PCAOB. Those standards require that we plan and perform the audit to obtain reasonable assurance about whether the consolidated financial statements are free of material misstatement, whether due to error or fraud. Our audits included performing procedures to assess the risks of material misstatement of the consolidated financial statements, whether due to error or fraud, and performing procedures that respond to those risks. Such procedures included examining, on a test basis, evidence regarding the amounts and disclosures in the consolidated financial statements. Our audits also included evaluating the accounting principles used and significant estimates made by management, as well as evaluating the overall presentation of the consolidated financial statements. We believe that our audits provide a reasonable basis for our opinion.
Critical Audit Matters
The critical audit matters communicated below are matters arising from the current period audit of the consolidated financial statements that were communicated or required to be communicated to the audit committee and that: (1) relate to accounts or disclosures that are material to the consolidated financial statements and (2) involved our especially challenging, subjective, or complex judgments. The communication of critical audit matters does not alter in any way our opinion on the consolidated financial statements, taken as a whole, and we are not, by communicating the critical audit matters below, providing separate opinions on the critical audit matters or on the accounts or disclosures to which they relate.
Liability for future policy benefits for term life insurance contracts
As described in Notes 1 and 10 to the consolidated financial statements, the liability for future policy benefits is measured as the present value of expected future benefits less the present value of expected future net premiums receivable under the contracts. The cash flow assumptions underlying the liability for future policy benefits include mortality, persistency, and
77
disability rates. The cash flow assumptions used to measure the liability for future policy benefits are reviewed at least annually and updated as necessary. As of December 31, 2023, the liability for future policy benefits was $6,742 million, which included the liability for future policy benefits for term life insurance contracts of $6,531 million.
We identified the evaluation of the liability for future policy benefits for term life insurance contracts as a critical audit matter. Specifically, the evaluation of the mortality, persistency and disability rate cash flow assumptions (collectively, key assumptions) used in estimating the liability for future policy benefits for term life insurance contracts required subjective auditor judgment and specialized skills and knowledge.
The following are the primary procedures we performed to address this critical audit matter. With the assistance of actuarial professionals with specialized skills and knowledge, we evaluated the design and tested the operating effectiveness of certain internal controls related to the Company’s process for estimating the liability for future policy benefits for term life insurance contracts. This included controls related to the actuarial methodologies and the key assumptions. We also involved actuarial professionals with specialized skills and knowledge, who assisted in:
Fair value of the Senior Health reporting unit
As described in Notes 1 and 22 to the consolidated financial statements, the Company’s goodwill balance was $128 million as of December 31, 2023, which is allocated to the Company’s Senior Health reporting unit. The Company performs an annual assessment of the recoverability of its goodwill on July 1 and also performs an assessment on an interim basis when events or changes in circumstances indicate that the carrying value of the reporting unit may exceed its fair value. The Company estimates the fair value of a reporting unit using a weighting of fair values derived from an income approach and a market approach. The Company performed the annual assessment of the recoverability of its goodwill on July 1, 2023. The estimated fair value of the reporting unit was then compared to its carrying value which did not result in recognizing an impairment charge, as the estimated fair value of the reporting unit exceeded its carrying value.
We identified the evaluation of the fair value of the Company’s Senior Health reporting unit used as part of the annual assessment of the recoverability of the related goodwill as a critical audit matter. Subjective auditor judgment and use of valuation professionals with specialized skills and knowledge were required in assessing the valuation approach, the weighting applied to each approach, and the significant assumptions used to develop the discount rate. Changes in the valuation approach and significant assumptions could have a significant impact on the estimated fair value of the Company’s Senior Health reporting unit.
The following are the primary procedures we performed to address this critical audit matter (1) evaluated the design and tested the operating effectiveness of certain internal controls related to the Company’s goodwill impairment process, including internal controls over management’s review of the valuation approach, the weighting applied to each approach, and the significant assumptions described above, and (2) evaluated the significant assumptions used in the determination of the discount rate. We also involved valuation professionals with specialized skills and knowledge who assisted in:
/s/ KPMG LLP
We have served as the Company’s auditor since 2007.
Atlanta, Georgia
February 28, 2024
78
PRIMERICA, INC. AND SUBSIDIARIES
Consolidated Balance Sheets
|
|
December 31, 2023 |
|
|
December 31, 2022 |
|
||
|
|
(In thousands, except per-share amounts) |
|
|||||
Assets: |
|
|
|
|
|
|
||
Investments: |
|
|
|
|
|
|
||
Fixed-maturity securities available-for-sale, at fair value (amortized cost: $ |
|
$ |
|
|
$ |
|
||
Fixed-maturity security held-to-maturity, at amortized cost (fair value: $ |
|
|
|
|
|
|
||
Short-term investments available-for-sale, at fair value (amortized cost: $ |
|
|
|
|
|
|
||
Equity securities, at fair value (historical cost: $ |
|
|
|
|
|
|
||
Trading securities, at fair value (cost: $ |
|
|
|
|
|
|
||
Policy loans and other invested assets |
|
|
|
|
|
|
||
Total investments |
|
|
|
|
|
|
||
Cash and cash equivalents |
|
|
|
|
|
|
||
Accrued investment income |
|
|
|
|
|
|
||
Reinsurance recoverables |
|
|
|
|
|
|
||
Deferred policy acquisition costs, net |
|
|
|
|
|
|
||
Renewal commissions receivable |
|
|
|
|
|
|
||
Agent balances, due premiums and other receivables |
|
|
|
|
|
|
||
Goodwill |
|
|
|
|
|
|
||
Intangible assets, net (accumulated amortization: $ |
|
|
|
|
|
|
||
Income tax receivable |
|
|
|
|
|
- |
|
|
Deferred income taxes |
|
|
|
|
|
|
||
Operating lease right-of-use assets |
|
|
|
|
|
|
||
Other assets |
|
|
|
|
|
|
||
Separate account assets |
|
|
|
|
|
|
||
Total assets |
|
$ |
|
|
$ |
|
||
|
|
|
|
|
|
|
||
Liabilities and Stockholders’ Equity: |
|
|
|
|
|
|
||
Liabilities: |
|
|
|
|
|
|
||
Future policy benefits |
|
$ |
|
|
$ |
|
||
Unearned and advance premiums |
|
|
|
|
|
|
||
Policy claims and other benefits payable |
|
|
|
|
|
|
||
Other policyholders’ funds |
|
|
|
|
|
|
||
Note payable |
|
|
|
|
|
|
||
Surplus note |
|
|
|
|
|
|
||
Income tax payable |
|
|
|
|
|
|
||
Deferred income taxes |
|
|
|
|
|
|
||
Operating lease liabilities |
|
|
|
|
|
|
||
Other liabilities |
|
|
|
|
|
|
||
Payable under securities lending |
|
|
|
|
|
|
||
Separate account liabilities |
|
|
|
|
|
|
||
|
|
|
|
|
|
|||
Total liabilities |
|
|
|
|
|
|
||
|
|
|
|
|
|
|
||
Temporary Stockholders’ Equity |
|
|
|
|
|
|
||
Redeemable noncontrolling interests in consolidated entities |
|
|
- |
|
|
|
- |
|
Permanent Stockholders’ Equity |
|
|
|
|
|
|
||
Equity attributable to Primerica, Inc.: |
|
|
|
|
|
|
||
Common stock ($ |
|
|
|
|
|
|
||
Paid-in capital |
|
|
- |
|
|
|
- |
|
Retained earnings |
|
|
|
|
|
|
||
Accumulated other comprehensive income (loss), net of income tax: |
|
|
|
|
|
|
||
Effect of change in discount rate assumptions on the liability for future policy benefits |
|
|
( |
) |
|
|
|
|
Unrealized foreign currency translation gains (losses) |
|
|
( |
) |
|
|
( |
) |
Net unrealized investment gains (losses) on available-for-sale securities |
|
|
( |
) |
|
|
( |
) |
Total permanent stockholders’ equity |
|
|
|
|
|
|
||
Total liabilities and temporary and permanent stockholders’ equity |
|
$ |
|
|
$ |
|
||
Prior year amounts related to long-duration insurance contracts have been adjusted for the adoption of accounting guidance on January 1, 2023.
See accompanying notes to consolidated financial statements.
79
PRIMERICA, INC. AND SUBSIDIARIES
Consolidated Statements of Income
|
|
Year ended December 31, |
|
|||||||||
|
|
2023 |
|
|
2022 |
|
|
2021 |
|
|||
|
|
(In thousands, except per-share amounts) |
|
|||||||||
Revenues: |
|
|
|
|
|
|
|
|
|
|||
Direct premiums |
|
$ |
|
|
$ |
|
|
$ |
|
|||
Ceded premiums |
|
|
( |
) |
|
|
( |
) |
|
|
( |
) |
Net premiums |
|
|
|
|
|
|
|
|
|
|||
Commissions and fees |
|
|
|
|
|
|
|
|
|
|||
Investment income net of investment expenses |
|
|
|
|
|
|
|
|
|
|||
Interest expense on surplus note |
|
|
( |
) |
|
|
( |
) |
|
|
( |
) |
Net investment income |
|
|
|
|
|
|
|
|
|
|||
Realized investment gains (losses) |
|
|
( |
) |
|
|
|
|
|
|
||
Other investment gains (losses) |
|
|
( |
) |
|
|
( |
) |
|
|
|
|
Investment gains (losses) |
|
|
( |
) |
|
|
( |
) |
|
|
|
|
Other, net |
|
|
|
|
|
|
|
|
|
|||
Total revenues |
|
|
|
|
|
|
|
|
|
|||
|
|
|
|
|
|
|
|
|
|
|||
Benefits and expenses: |
|
|
|
|
|
|
|
|
|
|||
Benefits and claims |
|
|
|
|
|
|
|
|
|
|||
Future policy benefits remeasurement (gain) loss |
|
|
( |
) |
|
|
|
|
|
|
||
Amortization of deferred policy acquisition costs |
|
|
|
|
|
|
|
|
|
|||
Sales commissions |
|
|
|
|
|
|
|
|
|
|||
Insurance expenses |
|
|
|
|
|
|
|
|
|
|||
Insurance commissions |
|
|
|
|
|
|
|
|
|
|||
Contract acquisition costs |
|
|
|
|
|
|
|
|
|
|||
Interest expense |
|
|
|
|
|
|
|
|
|
|||
Goodwill impairment loss |
|
|
- |
|
|
|
|
|
|
|
||
Loss on extinguishment of debt |
|
|
- |
|
|
|
- |
|
|
|
|
|
Other operating expenses |
|
|
|
|
|
|
|
|
|
|||
Total benefits and expenses |
|
|
|
|
|
|
|
|
|
|||
Income before income taxes |
|
|
|
|
|
|
|
|
|
|||
Income taxes |
|
|
|
|
|
|
|
|
|
|||
Net income |
|
|
|
|
|
|
|
|
|
|||
Net loss attributable to noncontrolling interests |
|
|
- |
|
|
|
( |
) |
|
|
( |
) |
Net income attributable to Primerica, Inc. |
|
$ |
|
|
$ |
|
|
$ |
|
|||
|
|
|
|
|
|
|
|
|
|
|||
Earnings per share attributable to common stockholders: |
|
|
|
|
|
|
|
|
|
|||
Basic earnings per share |
|
$ |
|
|
$ |
|
|
$ |
|
|||
Diluted earnings per share |
|
$ |
|
|
$ |
|
|
$ |
|
|||
|
|
|
|
|
|
|
|
|
|
|||
Weighted-average shares used in computing earnings |
|
|
|
|
|
|
|
|
|
|||
Basic |
|
|
|
|
|
|
|
|
|
|||
Diluted |
|
|
|
|
|
|
|
|
|
|||
|
|
|
|
|
|
|
|
|
|
|||
|
|
|
|
|
|
|
|
|
|
|||
Prior year amounts related to long-duration insurance contracts have been adjusted for the adoption of accounting guidance on January 1, 2023.
See accompanying notes to consolidated financial statements.
80
PRIMERICA, INC. AND SUBSIDIARIES
Consolidated Statements of Comprehensive Income
|
|
Year ended December 31, |
|
|
|||||||||
|
|
2023 |
|
|
2022 |
|
|
2021 |
|
|
|||
|
|
(In thousands) |
|
|
|||||||||
Net income |
|
$ |
|
|
$ |
|
|
$ |
|
|
|||
Other comprehensive income (loss) before income taxes: |
|
|
|
|
|
|
|
|
|
|
|||
Unrealized investment gains (losses) on available-for-sale securities: |
|
|
|
|
|
|
|
|
|
|
|||
Change in unrealized holding gains (losses) on available-for-sale securities |
|
|
|
|
|
( |
) |
|
|
( |
) |
|
|
Reclassification adjustment for investment (gains) losses included in net income |
|
|
|
|
|
( |
) |
|
|
( |
) |
|
|
Effect of change in discount rate assumptions on the liability for future policy benefits |
|
|
( |
) |
|
|
|
|
|
|
|
||
Foreign currency translation adjustments: |
|
|
|
|
|
|
|
|
|
|
|||
Change in unrealized foreign currency translation gains (losses) |
|
|
|
|
|
( |
) |
|
|
|
|
||
Total other comprehensive income (loss) before income taxes |
|
|
( |
) |
|
|
|
|
|
|
|
||
Income tax expense (benefit) related to items of other comprehensive income (loss) |
|
|
( |
) |
|
|
|
|
|
|
|
||
Other comprehensive income (loss), net of income taxes |
|
|
( |
) |
|
|
|
|
|
|
|
||
Total comprehensive income (loss) |
|
|
|
|
|
|
|
|
|
|
|||
Net income (loss) attributable to noncontrolling interests |
|
|
- |
|
|
|
( |
) |
|
|
( |
) |
|
Comprehensive income (loss) attributable to Primerica, Inc. |
|
$ |
|
|
$ |
|
|
$ |
|
|
|||
|
|
|
|
|
|
|
|
|
|
|
|||
Prior year amounts related to long-duration insurance contracts have been adjusted for the adoption of accounting guidance on January 1, 2023.
See accompanying notes to consolidated financial statements.
81
PRIMERICA, INC. AND SUBSIDIARIES
Consolidated Statements of Stockholders’ Equity
|
|
Year ended December 31, |
|
|||||||||
|
|
2023 |
|
|
2022 |
|
|
2021 |
|
|||
|
|
(In thousands, except per-share amounts) |
|
|||||||||
Equity attributable to Primerica, Inc./Permanent stockholders’ equity |
|
|
|
|
|
|
|
|
|
|||
Common stock: |
|
|
|
|
|
|
|
|
|
|||
Balance, beginning of period |
|
$ |
|
|
$ |
|
|
$ |
|
|||
Repurchases of common stock |
|
|
( |
) |
|
|
( |
) |
|
|
( |
) |
Net issuance of common stock |
|
|
|
|
|
|
|
|
|
|||
Balance, end of period |
|
|
|
|
|
|
|
|
|
|||
|
|
|
|
|
|
|
|
|
|
|||
Paid-in capital: |
|
|
|
|
|
|
|
|
|
|||
Balance, beginning of period |
|
|
- |
|
|
|
|
|
|
- |
|
|
Share-based compensation |
|
|
|
|
|
|
|
|
|
|||
Net issuance of common stock |
|
|
( |
) |
|
|
( |
) |
|
|
( |
) |
Repurchases of common stock |
|
|
( |
) |
|
|
( |
) |
|
|
( |
) |
Redemption of noncontrolling interest in consolidated entities |
|
|
- |
|
|
|
|
|
|
- |
|
|
Balance, end of period |
|
|
- |
|
|
|
- |
|
|
|
|
|
|
|
|
|
|
|
|
|
|
|
|||
Retained earnings: |
|
|
|
|
|
|
|
|
|
|||
Balance, beginning of period |
|
|
|
|
|
|
|
|
|
|||
|
|
- |
|
|
|
- |
|
|
|
( |
) |
|
Adjusted balance |
|
|
|
|
|
|
|
|
|
|||
Net income |
|
|
|
|
|
|
|
|
|
|||
Dividends |
|
|
( |
) |
|
|
( |
) |
|
|
( |
) |
Repurchases of common stock |
|
|
( |
) |
|
|
( |
) |
|
|
- |
|
Balance, end of period |
|
|
|
|
|
|
|
|
|
|||
|
|
|
|
|
|
|
|
|
|
|||
Accumulated other comprehensive income (loss): |
|
|
|
|
|
|
|
|
|
|||
Balance, beginning of period |
|
|
( |
) |
|
|
( |
) |
|
|
|
|
|
|
- |
|
|
|
- |
|
|
|
( |
) |
|
Adjusted balance |
|
|
( |
) |
|
|
( |
) |
|
|
( |
) |
Effect of change in discount rate assumptions on the liability for future policy benefits, net of income taxes |
|
|
( |
) |
|
|
|
|
|
|
||
Change in foreign currency translation adjustment, net of income taxes |
|
|
|
|
|
( |
) |
|
|
|
||
Change in net unrealized investment gains (losses) during the period, net of income taxes |
|
|
|
|
|
( |
) |
|
|
( |
) |
|
Balance, end of period |
|
|
( |
) |
|
|
( |
) |
|
|
( |
) |
Total permanent stockholders’ equity |
|
$ |
|
|
$ |
|
|
$ |
|
|||
|
|
|
|
|
|
|
|
|
|
|||
Redeemable noncontrolling interests in consolidated entities/Temporary stockholders’ equity |
|
|
|
|
|
|
|
|
|
|||
Balance, beginning of period |
|
$ |
- |
|
|
$ |
|
|
$ |
- |
|
|
Acquisition of noncontrolling interest |
|
|
- |
|
|
|
- |
|
|
|
|
|
Net income (loss) attributable to noncontrolling interests |
|
|
- |
|
|
|
( |
) |
|
|
( |
) |
Changes in noncontrolling interests in consolidated entities, net |
|
|
- |
|
|
|
- |
|
|
|
|
|
Redemption of noncontrolling interest in consolidated entities |
|
|
- |
|
|
|
( |
) |
|
|
- |
|
Balance, end of period |
|
$ |
- |
|
|
$ |
- |
|
|
$ |
|
|
|
|
|
|
|
|
|
|
|
|
|||
Dividends declared per share |
|
$ |
|
|
$ |
|
|
$ |
|
|||
Prior year amounts related to long-duration insurance contracts have been adjusted for the adoption of accounting guidance on January 1, 2023.
See accompanying notes to consolidated financial statements.
82
PRIMERICA, INC. AND SUBSIDIARIES
Consolidated Statements of Cash Flows
|
|
Year ended December 31, |
|
|||||||||
|
|
2023 |
|
|
2022 |
|
|
2021 |
|
|||
|
|
(In thousands) |
|
|||||||||
Cash flows from operating activities: |
|
|
|
|
|
|
|
|
|
|||
Net income |
|
$ |
|
|
$ |
|
|
$ |
|
|||
Adjustments to reconcile net income to cash provided by (used in) operating activities: |
|
|
|
|
|
|
|
|
|
|||
Change in future policy benefits and other policy liabilities |
|
|
|
|
|
( |
) |
|
|
( |
) |
|
Deferral of policy acquisition costs |
|
|
( |
) |
|
|
( |
) |
|
|
( |
) |
Amortization of deferred policy acquisition costs |
|
|
|
|
|
|
|
|
|
|||
Deferred tax provision |
|
|
( |
) |
|
|
( |
) |
|
|
|
|
Change in income taxes |
|
|
( |
) |
|
|
|
|
|
|
||
Investment (gains) losses |
|
|
|
|
|
|
|
|
( |
) |
||
Accretion and amortization of investments |
|
|
( |
) |
|
|
|
|
|
|
||
Depreciation and amortization |
|
|
|
|
|
|
|
|
|
|||
Change in reinsurance recoverables |
|
|
|
|
|
|
|
|
|
|||
Change in agent balances, due premiums and other receivables |
|
|
( |
) |
|
|
( |
) |
|
|
|
|
Change in renewal commissions receivable |
|
|
|
|
|
|
|
|
( |
) |
||
Trading securities sold, matured, or called (acquired), net |
|
|
( |
) |
|
|
|
|
|
( |
) |
|
Share-based compensation |
|
|
|
|
|
|
|
|
|
|||
Goodwill impairment loss |
|
|
- |
|
|
|
|
|
|
|
||
Loss on extinguishment of debt |
|
|
- |
|
|
|
- |
|
|
|
|
|
Change in other operating assets and liabilities, net |
|
|
|
|
|
( |
) |
|
|
|
||
Net cash provided by (used in) operating activities |
|
|
|
|
|
|
|
|
|
|||
|
|
|
|
|
|
|
|
|
|
|||
Cash flows from investing activities: |
|
|
|
|
|
|
|
|
|
|||
Available-for-sale investments sold, matured or called: |
|
|
|
|
|
|
|
|
|
|||
Fixed-maturity securities — sold |
|
|
|
|
|
|
|
|
|
|||
Fixed-maturity securities — matured or called |
|
|
|
|
|
|
|
|
|
|||
Short-term investments — sold |
|
|
|
|
|
|
|
|
|
|||
Short-term investments — matured or called |
|
|
|
|
|
|
|
|
|
|||
Equity securities — sold |
|
|
|
|
|
|
|
|
|
|||
Equity securities — matured or called |
|
|
- |
|
|
|
|
|
|
- |
|
|
Available-for-sale investments acquired: |
|
|
|
|
|
|
|
|
|
|||
Fixed-maturity securities |
|
|
( |
) |
|
|
( |
) |
|
|
( |
) |
Short-term investments |
|
|
( |
) |
|
|
( |
) |
|
|
( |
) |
Equity securities — acquired |
|
|
( |
) |
|
|
( |
) |
|
|
( |
) |
Purchases of property and equipment and other investing activities, net |
|
|
( |
) |
|
|
( |
) |
|
|
( |
) |
Cash collateral received (returned) on loaned securities, net |
|
|
( |
) |
|
|
|
|
|
|
||
Sales (purchases) of short-term investments using securities lending collateral, net |
|
|
|
|
|
( |
) |
|
|
( |
) |
|
Purchase of business, net of cash acquired |
|
|
- |
|
|
|
|
|
|
( |
) |
|
Net cash provided by (used in) investing activities |
|
|
( |
) |
|
|
( |
) |
|
|
( |
) |
|
|
|
|
|
|
|
|
|
|
|||
Cash flows from financing activities: |
|
|
|
|
|
|
|
|
|
|||
Dividends paid |
|
|
( |
) |
|
|
( |
) |
|
|
( |
) |
Common stock repurchased |
|
|
( |
) |
|
|
( |
) |
|
|
( |
) |
Proceeds from revolving credit facility |
|
|
- |
|
|
|
- |
|
|
|
|
|
Repayment of revolving credit facility |
|
|
- |
|
|
|
- |
|
|
|
( |
) |
Proceeds from issuance of debt |
|
|
- |
|
|
|
- |
|
|
|
|
|
Debt issuance costs |
|
|
- |
|
|
|
- |
|
|
|
( |
) |
Repayment of debt |
|
|
- |
|
|
|
- |
|
|
|
( |
) |
Payment on note issued to seller of business |
|
|
- |
|
|
|
( |
) |
|
|
- |
|
Tax withholdings on share-based compensation |
|
|
( |
) |
|
|
( |
) |
|
|
( |
) |
Finance leases |
|
|
( |
) |
|
|
( |
) |
|
|
( |
) |
Net cash provided by (used in) financing activities |
|
|
( |
) |
|
|
( |
) |
|
|
|
|
Effect of foreign exchange rate changes on cash |
|
|
|
|
|
( |
) |
|
|
|
||
Change in cash and cash equivalents |
|
|
|
|
|
|
|
|
( |
) |
||
Cash and cash equivalents, beginning of period |
|
|
|
|
|
|
|
|
|
|||
Cash and cash equivalents, end of period |
|
$ |
|
|
$ |
|
|
$ |
|
|||
|
|
|
|
|
|
|
|
|
|
|||
Supplemental disclosures of cash flow information: |
|
|
|
|
|
|
|
|
|
|||
Income taxes paid |
|
$ |
|
|
$ |
|
|
$ |
|
|||
Interest paid |
|
|
|
|
|
|
|
|
|
|||
Non-cash activities: |
|
|
|
|
|
|
|
|
|
|||
Increases in note issued to seller of business |
|
|
- |
|
|
|
- |
|
|
|
|
|
Prior year amounts related to long-duration insurance contracts have been adjusted for the adoption of accounting guidance on January 1, 2023.
See accompanying notes to consolidated financial statements.
83
PRIMERICA, INC. AND SUBSIDIARIES
Notes to Consolidated Financial Statements
(1) Description of Business, Basis of Presentation, and Summary of Significant Accounting Policies
Description of Business. Primerica, Inc. (the “Parent Company”), together with its subsidiaries (collectively, “we”, “us” or the “Company”), is a leading provider of financial products and services to middle-income households in the United States and Canada through a network of independent contractor sales representatives (“independent sales representatives” or “independent sales force”). We assist our clients in meeting their needs for term life insurance, which we underwrite, and mutual funds, annuities, managed investments and other financial products, which we distribute primarily on behalf of third parties. We acquired
Basis of Presentation. We prepare our financial statements in accordance with U.S. generally accepted accounting principles (“U.S. GAAP”). These principles are established primarily by the Financial Accounting Standards Board (“FASB”).
Use of Estimates. The preparation of financial statements in conformity with U.S. GAAP requires us to make estimates and assumptions that affect financial statement balances, revenues and expenses and cash flows, as well as the disclosure of contingent assets and liabilities. Management considers available facts and knowledge of existing circumstances when establishing the estimates included in our financial statements. The most significant items that involve a greater degree of accounting estimates and actuarial determinations subject to change in the future are the valuation of investments, deferred policy acquisition costs (“DAC”), liability for future policy benefit reserves (“LFPB”) and corresponding amounts recoverable from reinsurers, renewal commissions receivable, income taxes, and valuation of goodwill. Estimates for these and other items are subject to change and are reassessed by management in accordance with U.S. GAAP. Actual results could differ from those estimates.
Consolidation. The accompanying consolidated financial statements include the accounts of the Company and those entities required to be consolidated under U.S. GAAP. All material intercompany profits, transactions, and balances among the consolidated entities have been eliminated.
Reclassifications. Certain reclassifications have been made to prior-period amounts to conform to current-period reporting classifications. These reclassifications had no impact on net income or total stockholders’ equity.
Foreign Currency Translation. Assets and liabilities of our Canadian subsidiaries are translated into U.S. dollars using year-end exchange rates, and the translation adjustments are reported in other comprehensive income (loss). Revenues and expenses of our Canadian subsidiaries are translated monthly at amounts that approximate weighted-average exchange rates.
Investments. Investments are reported on the following bases:
Investment transactions are recorded on a trade-date basis. We use the specific-identification method to determine the realized gains or losses from securities transactions and report the investment gains or losses in the accompanying consolidated statements of income.
Unrealized gains and losses on AFS securities are included as a separate component of other comprehensive income (loss), except for credit loss impairment discussed below.
84
For an AFS security with an amortized cost that exceeds its fair value, we first determine if we intend to sell or will more-likely-than-not be required to sell the security before the expected recovery of its amortized cost. If we intend to sell or will more-likely-than-not be required to sell the security, then we recognize the impairment as a credit loss in our consolidated statements of income by writing down the security’s amortized cost to its fair value. If we do not intend to sell or it is not more-likely-than-not that we will be required to sell the security before the expected recovery of its amortized cost, we recognize the portion of the impairment that is due to a credit loss, if any, in our consolidated statements of income through an allowance. The portion of the impairment that is due to factors other than a credit loss is recognized in other comprehensive income in the consolidated statements of comprehensive income as an unrealized loss. Credit losses recognized in the allowance for credit losses are reversed in situations where the estimate of credit losses on those securities has declined. When determining whether an impairment is due to a credit loss or other factors, we determine the extent to which we do not expect to recover the security’s amortized cost and record such amount, if any, as a credit loss. Factors we consider in determining whether the security’s decline in fair value is below amortized cost due to a credit loss include the magnitude of the security’s decline in fair value below its amortized cost, the financial condition, long and near-term prospects for the issuer, industry conditions and trends, rating agency actions, the payment structure of the security, likelihood of the recoverability of principal and interest, and our ability and intent to hold the security for a period of time sufficient to allow for the anticipated recovery of its amortized cost. In assessing our ability and intent to hold the security for a period of time to allow for the anticipated recovery of its amortized cost, we also consider our anticipated sources of cash to fund operating activities and share repurchases. If we do not anticipate recovering a security’s amortized cost basis, we estimate the present value of the security’s expected cash flows and recognize the difference from amortized cost (using fair value as a floor) as a credit loss.
Interest income on fixed-maturity securities is recorded when earned by determining the effective yield, which gives consideration to amortization of premiums, accretion of discounts, and any previous credit losses. Dividend income on equity securities is recorded when declared. These amounts are included in net investment income in the accompanying consolidated statements of income.
Included within fixed-maturity securities are loan-backed and asset-backed securities. Amortization of the premium or accretion of the discount uses the retrospective method. The effective yield used to determine amortization/accretion is calculated based on actual and historical projected future cash flows and updated quarterly.
Cash and Cash Equivalents. Cash and cash equivalents include cash on hand, money market instruments, and all other highly liquid investments purchased with an original or remaining maturity of three months or less at the date of acquisition.
Reinsurance. We use reinsurance extensively, utilizing yearly renewable term (“YRT”) and coinsurance agreements. Under YRT agreements, we reinsure only the mortality risk, while under coinsurance, we reinsure a proportionate part of all risks arising under the reinsured policy. Under coinsurance, the reinsurer receives a proportionate part of the premiums, less commission allowances, and is liable for a corresponding part of all benefit payments.
All reinsurance contracts in effect for the three-year period ended December 31, 2023 transfer a reasonable possibility of substantial loss to the reinsurer or are accounted for under the deposit method of accounting.
Ceded premiums are treated as a reduction to direct premiums and are recognized when due to the assuming company. Ceded claims are treated as a reduction to direct benefits and are recognized when the claim is incurred on a direct basis. Ceded policy benefit reserve changes are also treated as a reduction to benefits and claims expense and are recognized during the applicable financial reporting period.
Reinsurance premiums, commissions, expense reimbursements and ceded policy benefit reserves related to reinsured long-duration contracts are accounted for over the life of the underlying contracts using assumptions consistent with those used to account for the underlying policies. Amounts recoverable from reinsurers are estimated in a manner consistent with the claim liabilities and the LFPB associated with reinsured policies. Ceded policy benefit reserves and claims liabilities relating to insurance ceded are shown as reinsurance recoverables on the consolidated balance sheets.
We analyze and monitor the credit-worthiness of each of our reinsurance partners to minimize collection issues. For reinsurance contracts with unauthorized reinsurers, we require collateral such as letters of credit.
To the extent we receive ceding allowances to cover policy and claims administration under reinsurance contracts, these allowances are treated as a reduction to insurance commissions and expenses and are recognized when due from the assuming company. To the extent we receive ceding allowances reimbursing commissions that would otherwise be deferred, the amount of commissions deferrable will be reduced. The corresponding DAC balances are reduced on a pro rata basis by the portion of the business reinsured with reinsurance agreements that meet risk transfer provisions. The reduced DAC will result in a corresponding reduction of amortization expense.
We estimate and recognize lifetime expected credit losses for reinsurance recoverables. In estimating the allowance for expected credit losses for reinsurance recoverables, we factor in the underlying collateral for reinsurance agreements where available. Specifically, for reinsurers with underlying trust assets, we compare the reinsurance recoverables balance to the underlying trust assets that mitigate the potential exposure to credit losses. We also analyze the financial condition of the reinsurers, as determined by third-party rating agencies, to determine the probability of default for the reinsurers. We then utilize a third-party credit default study to calculate an
85
expected credit loss given default rate or recovery rate. The probability of default and loss given default rates are then applied to the reinsurers’ recoverable balances, while also factoring in any third-party letters of credit that support the reinsurance agreement, in order to calculate our allowance for credit losses.
DAC. We defer incremental direct costs of successful contract acquisitions that result from and are essential to the contract transaction(s) and that would not have been incurred had the contract transaction(s) not occurred. These deferred policy acquisition costs mainly include commissions, underwriting costs and certain other policy issuance expenses associated with successful contract acquisitions. All other acquisition-related costs, including unsuccessful acquisition and renewal efforts, are charged to expense as incurred. Also, administrative costs, rent, depreciation, occupancy, equipment, and all other general overhead costs are considered indirect costs and are charged to expense as incurred.
DAC for term life insurance policies is amortized on a constant-level basis over the expected term of the contracts using face amount as the unit of measure. Contracts are grouped by cohorts consistent with the grouping used in estimating the LFPB. The cohorts are defined by the legal entity that issued the policy and the year the policy was issued. Assumptions of face amounts used to amortize DAC for term life insurance policies, including persistency and mortality, are consistent with the assumptions used in estimating the LFPB.
DAC for Canadian segregated funds is amortized on a constant-level basis over the expected term of the contracts using policy count as the unit of measure. Contracts are grouped by cohorts based on the issue year of the policy.
Interest is not accrued on unamortized DAC balances, and DAC is not subject to impairment testing.
Goodwill. Goodwill represents the excess of the purchase price over the estimated acquired values of identifiable assets and liabilities acquired in a business combination at the acquisition date. In accordance with U.S. GAAP, goodwill is not amortized. The Company tests goodwill for impairment annually on July 1 and whenever events occur or circumstances change that would indicate the carrying value of goodwill more likely than not exceeds its fair value. All of the Company’s goodwill was obtained from the e-TeleQuote acquisition and the e-TeleQuote business has been designated as a separate operating segment called Senior Health. Therefore, goodwill has been allocated solely to the Senior Health segment and is evaluated for impairment at the Senior Health segment level, which is also defined as the reporting unit. For additional information on the results of the annual goodwill impairment test, see Note 22 (Goodwill).
Intangible Assets. Intangible assets are amortized over their estimated useful lives. Any intangible asset that was deemed to have an indefinite useful life is not amortized but is subject to an annual impairment test. An impairment exists if the carrying value of the indefinite-lived intangible asset exceeds its fair value. For the other intangible assets, which are subject to amortization, an impairment is recognized if the carrying amount is not recoverable and exceeds the fair value of the intangible asset.
The components of intangible assets were as follows:
|
|
December 31, |
|
|||||||||||||||||||||
|
|
2023 |
|
|
2022 |
|
||||||||||||||||||
|
|
Gross carrying amount |
|
|
Accumulated amortization |
|
|
Net carrying amount |
|
|
Gross carrying amount |
|
|
Accumulated amortization |
|
|
Net carrying amount |
|
||||||
|
|
(In thousands) |
|
|||||||||||||||||||||
Indefinite-lived intangible asset |
|
$ |
|
|
n/a |
|
|
$ |
|
|
$ |
|
|
n/a |
|
|
$ |
|
||||||
Amortizing intangible assets |
|
|
|
|
|
( |
) |
|
|
|
|
|
|
|
|
( |
) |
|
|
|
||||
Total intangible assets |
|
$ |
|
|
$ |
( |
) |
|
$ |
|
|
$ |
|
|
$ |
( |
) |
|
$ |
|
||||
We have an indefinite-lived intangible asset related to the 1989 purchase of the right to contract with the sales force. This asset represents the core distribution model of our business, which is our primary competitive advantage to profitably distribute term life insurance and investment and savings products on a significant scale, and as such, is considered to have an indefinite life. This indefinite-lived intangible asset is supported by a significant portion of the discounted cash flows of our future business. We assessed this asset for impairment as of its annual assessment date, October 1, 2023, and determined that no impairment had occurred.
Intangible assets acquired from the acquisition of e-TeleQuote consist primarily of relationships with health insurance carriers, who are our customers, and are amortized over their estimated useful lives. The Company uses an estimated useful life of
86
non-exclusive, and pay-for-performance. Intangible asset amortization expense was $
Property and Equipment. Property and equipment, which are included in other assets, are stated at cost, less accumulated depreciation.
|
|
Estimated Useful Life |
Data processing equipment and software |
|
|
Leasehold improvements |
|
Lesser of |
Furniture and other equipment |
|
Depreciation expense is included in other operating expenses in the consolidated statements of income. Depreciation expense was $
Property and equipment balances were as follows:
|
|
December 31, |
|
|||||
|
|
2023 |
|
|
2022 |
|
||
|
|
(In thousands) |
|
|||||
Data processing equipment and software |
|
$ |
|
|
$ |
|
||
Leasehold improvements |
|
|
|
|
|
|
||
Other, principally furniture and equipment |
|
|
|
|
|
|
||
|
|
|
|
|
|
|
||
Accumulated depreciation |
|
|
( |
) |
|
|
( |
) |
Net property and equipment |
|
$ |
|
|
$ |
|
||
Separate Accounts. The separate accounts are primarily composed of contracts issued by the Company through its subsidiary, Primerica Life Canada, pursuant to the Insurance Companies Act (Canada). The Insurance Companies Act authorizes Primerica Life Canada to establish the separate accounts.
The separate accounts are represented by individual variable insurance contracts. Purchasers of variable insurance contracts issued by Primerica Life Canada have a direct claim to the benefits of the contract that entitles the holder to units in one or more investment funds (the “Funds”) maintained by Primerica Life Canada. The Funds invest in assets that are held for the benefit of the owners of the contracts. The Funds’ assets are administered by Primerica Life Canada and are held separate and apart from the general assets of the Company. The liabilities reflect the variable insurance contract holders’ interests in the Funds’ net assets based upon actual investment performance of the respective Funds. Separate accounts operating results relating to contract holders’ interests are excluded from our consolidated statements of income.
These Funds primarily consist of a series of branded investment funds known as the Asset Builder Funds, a registered retirement fund known as the Strategic Retirement Income Fund (“SRIF”), and a money market fund known as the Cash Management Fund. The principal investment objective of the Asset Builder Funds is to achieve long-term growth while preserving capital. The principal objective of the SRIF is to provide a stream of investment income during retirement plus the opportunity for modest capital appreciation. The Asset Builder Funds and the SRIF use diversified portfolios of publicly-traded Canadian stocks, investment-grade corporate bonds, Government of Canada bonds, and foreign equity investments to achieve their objectives. The Cash Management Fund invests in government guaranteed short-term bonds and short-term commercial and bank papers, with the principal investment objective being the provision of interest income while maintaining liquidity and preserving capital.
Under these contract offerings, benefit payments to contract holders or their designated beneficiaries are only due upon death of the annuitant or upon reaching a specific maturity date. Benefit payments are based on the value of the contract holder’s units in the portfolio at the payment date, but are guaranteed to be no less than
Both the asset and the liability for the separate accounts reflect the net value of the underlying assets in the portfolio as of the reporting date. Primerica Life Canada’s exposure to losses under the guarantee at the time of account maturity is limited to contract holder accounts that have declined in value more than
87
Additionally, the portfolios consist of a very large number of individual contracts, further spreading the risk related to the guarantee. The length of the contract terms provides significant opportunity for the underlying portfolios to recover any short-term losses prior to maturity or the death of the contract holder. The Company has estimated the fair value associated with the market risk benefits provided by these limited guarantees to be immaterial. Furthermore, the Funds’ investment allocations are aligned with the maturity risks of the related contracts and include investments in Government Strip Bonds and floating-rate notes.
Renewal Commissions Receivable. Renewal commissions receivable are contract assets that represent the renewal portion of estimated constrained variable consideration recognized in accordance with ASC Topic 606, Revenue from Contracts with Customers (“ASC 606”). Renewal commissions receivable primarily consist of the expected value of commissions to be collected by e-TeleQuote from the distribution of Medicare-related health insurance policies where the performance obligation has been satisfied but payment is not due as the underlying policy has not yet renewed. The estimate of renewal commissions requires significant judgment subject to the same assumptions as noted under “Commissions and Fees – Senior Health” below. Cash collections for these receivables are expected to occur over a period of several years. Renewal commissions receivable will be adjusted for differences between actual and expected cash collections as well as for changes in estimates. Under ASC 606, these receivables are not discounted as the timing for collection of payments is dependent on future policyholder renewals and not due to the presence of a significant financing component. Refer to Note 21 (Acquisition) for renewal commissions receivable recognized as part of the acquisition of e-TeleQuote.
Liability for Future Policy Benefits. The LFPB on traditional life insurance products is established for future policy benefits, which includes death benefits, waiver of premium benefits and claim settlement expenses. The LFPB is calculated as the present value of expected future benefits less the present value of expected future net premiums receivable under the contracts. Net premiums are defined as the portion of the gross premiums received from policyholders that are needed to pay for all benefits.
The assumptions underlying the LFPB include mortality, persistency, disability rates, and other assumptions that reflect our best estimate based on our historical experience and modified, as necessary, to reflect non-recurring and/or anticipated trends.
The LFPB is estimated by grouping insurance policies into cohorts. Policy cohorts for the Term Life Insurance segment are based on the legal entity that issued the policy and the year the policy was issued.
The cash flows and assumptions underlying the LFPB are unlocked each quarter to reflect differences between actual and expected experience. In general, assumption changes, to the extent necessary, are expected to only occur during the third quarter when we update our experience studies. However, they may occur at any time based on emerging experience.
The impact of unlocking will be partly reflected in the current period and partly spread to future periods based on the remaining duration of the impacted cohort(s). The catch-up is retroactive back to the later of January 1, 2021 (the “Transition Date”) or issue date, after reinsurance recoverables and is recognized as a remeasurement gain or loss as a separate component of benefits and claims expense in the consolidated statements of income.
The ceded reserve balances included in reinsurance recoverables are calculated in the same manner as the LFPB by cohort and apply best estimate assumptions and quarterly unlocking.
The Company uses discount rates applied by country to align with local currency cash flows. Discount rates consist of yield curves that are developed using Bloomberg’s Evaluated Pricing Product based on senior unsecured fixed rate bonds ratings of A+, A or A-. The discount rate assumption is updated quarterly and the impact of remeasuring the net LFPB, after reinsurance recoverables from changes in the locked-in discount rate assumption is reflected in other comprehensive income in the consolidated statements of comprehensive income.
The LFPB we establish is necessarily based on estimates, assumptions and our analysis of historical experience. Factors that could cause prospective assumptions to be different from historical experience include but are not limited to our term life product series, economic and societal trends, new pharmaceutical drugs, and the impact of regulatory changes. Our results depend upon the extent to which our actual experience is consistent with the assumptions we use in determining the LFPB. The assumptions and estimates underlying the LFPB require significant judgment and, therefore, are inherently uncertain.
Unearned and Advance Premiums. Unearned and advance premiums primarily consist of premiums received from policyholders in advance of the premiums due date. Unearned and advance premiums are deferred upon collection and recognized as premiums revenue upon the premium due date.
Other Policyholders’ Funds. Other policyholders’ funds primarily represent claim payments left on deposit with us.
Litigation. The Company is involved from time-to-time in legal disputes, regulatory inquiries and arbitration proceedings in the normal course of business. Contingent litigation-related losses are recognized when probable and can be reasonably estimated. Legal costs, such as attorneys’ fees and other litigation-related expenses that are incurred in connection with resolving litigation are expensed as incurred. These disputes are subject to uncertainties, including indeterminate amounts sought in certain of these matters and the inherent unpredictability of litigation. Due to the difficulty of estimating costs of litigation, actual costs may be substantially higher or lower than any amounts reserved.
88
Income Taxes. We are subject to the income tax laws of the United States, its states, municipalities, and certain unincorporated territories, as well as foreign jurisdictions, most notably Canada. These tax laws can be complex and subject to different interpretations by the taxpayer and the relevant governmental taxing authorities. In establishing a provision for income tax expense, we must make judgments and interpretations about the applicability of these tax laws. We also must make estimates about the future impact certain items will have on taxable income in the various tax jurisdictions, both domestic and foreign.
Income taxes are accounted for under the asset and liability method. Deferred tax assets and liabilities are recognized for the future tax consequences attributable to: (i) differences between the financial statement carrying amounts of acquired assets and liabilities and their respective tax bases and (ii) acquired e-TeleQuote net operating loss and interest deduction carryforwards available for future use. Deferred tax assets and liabilities are measured using enacted tax rates expected to apply to taxable income in the years in which those temporary differences are expected to be recovered or settled. Deferred tax assets are recognized subject to management’s judgment that realization is more-likely-than-not applicable to the periods in which we expect the temporary difference will reverse. The Company has not recognized any material deferred taxes associated with goodwill as it has not acquired any material goodwill with tax basis. Refer to Note 21 (Acquisition) for deferred income taxes recognized as part of the acquisition of e-TeleQuote.
Noncontrolling Interest. In connection with the Company’s acquisition of e-TeleQuote, the Company entered into a shareholders’ agreement with the noncontrolling equity holders of Primerica Health (the “Shareholders’ Agreement”). Under the terms of the Shareholders’ Agreement, the Company agreed to purchase, and the noncontrolling equity holders agreed to sell, the remaining
Prior to redemption, the Company adjusted the Redeemable NCI for net income (loss) attributable to the noncontrolling interests in Primerica Health. Upon redemption, the Redeemable NCI in the temporary stockholders’ equity section of the consolidated balance sheets was eliminated through an adjustment to additional paid in capital as no further consideration was required.
Premium Revenues. Traditional life insurance products consist principally of those products with fixed and guaranteed premiums and benefits, and are primarily related to term products. Premiums are recognized as revenues when due.
Commissions and Fees. We receive commissions and fees revenue from the sale of various non-life insurance products. Commissions revenue is generally received on the sale of mutual funds and annuities. We also receive trail commissions revenue from mutual fund and annuity products based on the net asset value of shares sold by us. We, in turn, pay sales commissions to the sales force. We also receive investment advisory and administrative fees based on the average daily net asset value of client assets held in managed investments programs and contracts related to separate account assets issued by Primerica Life Canada. We, in turn, pay asset-based commissions to the sales force. We earn recordkeeping fees for transfer agent recordkeeping services that we perform on behalf of several of our mutual fund providers and custodial fees for services performed as a non-bank custodian of our clients’ retirement plan accounts. See Note 19 (Revenue from Contracts with Customers) for details related to our commission and fees revenues recognition policies.
Commissions and Fees – Senior Health. As a result of the acquisition of e-TeleQuote, the Company distributes Medicare-related insurance policies offered by third-party health insurance carriers to eligible Medicare beneficiaries. e-TeleQuote receives initial commissions from health insurance carriers, who are considered its customers, for enrollments in policies it has distributed as well as ongoing renewal commissions that coincide with the period an eligible Medicare beneficiary remains enrolled in a policy after the first policy effective date (collectively, “Lifetime value of commissions” or “LTV”). Revenue is recognized at the point in time e-TeleQuote’s single performance obligation to health insurance carriers is satisfied, which is generally on the date the policy application is approved by the health insurance carrier. The expected commissions represent variable consideration that will not be resolved until after the performance obligation has been satisfied. The Company estimates variable consideration in the transaction price for policies it has distributed as the expected amount of initial and renewal commissions to be received over the life of the enrolled policy. Variable consideration is estimated by using a portfolio approach to policies grouped together by health insurance carrier, Medicare product type, and policy effective date (referred to as a “cohort”). This approach to estimating the initial and renewal commissions expected to be collected involves the evaluation of various factors, including but not limited to, contracted commission rates, disenrollment experience and renewal persistency rates. Upon development of the estimate of expected renewal commissions using the portfolio approach, management applies a constraint so that it is probable that a subsequent change in estimate will not result in a significant revenue reversal. Management judgment is required to determine the inputs to these estimates and the inputs are established primarily based on historical activity. There could be situations where new facts or circumstances, that were not available
89
at the time of the initial estimate, may indicate that the expected renewal commissions are higher or lower than our renewal commissions receivable. In those situations, the expected renewal commissions receivable will be written down or up to its revised expected value by adjustments to revenue, which we refer to as tail revenue adjustments. Refer to Note 19 (Revenue from Contracts with Customers) for detail related to commissions and fees revenues recognized by e-TeleQuote.
Benefits and Expenses. Benefit and expense items are charged to income in the period in which they are incurred. Both the change in policyholder liabilities, which is included in benefits and claims, and the amortization of deferred policy acquisition costs will vary with policyholder persistency.
Share-Based Transactions. For employee and director share-based compensation awards, we determine a grant date fair value based on the price of our publicly-traded common stock and recognize the related compensation expense, adjusted for actual forfeitures, in the consolidated statements of income on a straight-line basis over the requisite service period for the entire award. For non-employee share-based compensation, we recognize the impact during the period of performance, and the fair value of the award is measured as of the grant date, which occurs in the same quarter as the service period. To the extent non-employee share-based compensation is an incremental direct cost of successful acquisitions or renewals of life insurance policies that result directly from and are essential to the policy acquisition(s) and would not have been incurred had the policy acquisition(s) not occurred, we defer and amortize the fair value of the awards in the same manner as other deferred policy acquisition costs.
Earnings Per Share (“EPS”). The Company has outstanding equity awards that consist of restricted stock units (“RSUs”), performance-based stock units (“PSUs”), and stock options. The RSUs maintain non-forfeitable dividend rights that result in dividend payment obligations on a one-to-one ratio with common shares for any future dividend declarations. Unvested RSUs are deemed participating securities for purposes of calculating EPS as they maintain dividend rights.
See Note 14 (Earnings Per Share) for details related to the calculations of our basic and diluted EPS using the two-class method.
New Accounting Standards Adopted. In August 2018, the FASB issued , Financial Services—Insurance (Topic 944) — Targeted Improvements to the Accounting for Long-Duration Contracts (“ASU 2018-12” or “LDTI”). The amendments in this update changed accounting guidance for insurance companies that issue long-duration contracts, such as and segregated funds products. ASU 2018-12 requires companies that issue long-duration insurance contracts to review assumptions used in measuring the LFPB and DAC, including mortality, disability, and persistency, at least annually and update as necessary instead of locking those assumptions at contract inception and reflecting differences in assumptions and actual performance as the experience occurs. ASU 2018-12 also changed how insurance companies that issue long-duration contracts amortize DAC and determine and update the discount rate assumptions used in measuring both the LFPB and ceded reserves that are part of reinsurance recoverables while increasing the level of financial statement disclosures required.
The Company
The impact of LDTI on the Company’s audited consolidated balance sheet as of December 31, 2022 as previously reported before the adoption of LDTI (“Previously Reported”) is as follows:
90
Consolidated Balance Sheet |
|
|||||||||||
December 31, 2022 |
|
|||||||||||
|
|
|
|
|
|
|
|
|
|
|||
|
|
As Previously Reported |
|
|
Adoption Impacts |
|
|
As Adjusted |
|
|||
|
|
(In thousands, except per-share amounts) |
|
|||||||||
Assets: |
|
|
|
|
|
|
|
|
|
|||
Investments: |
|
|
|
|
|
|
|
|
|
|||
Fixed-maturity securities available-for-sale, at fair value (amortized cost: $ |
|
$ |
|
|
$ |
- |
|
|
$ |
|
||
Fixed-maturity security held-to-maturity, at amortized cost (fair value: $ |
|
|
|
|
|
- |
|
|
|
|
||
Short-term investments available-for-sale, at fair value (amortized cost: $ |
|
|
|
|
|
- |
|
|
|
|
||
Equity securities, at fair value (historical cost: $ |
|
|
|
|
|
- |
|
|
|
|
||
Trading securities, at fair value (cost: $ |
|
|
|
|
|
- |
|
|
|
|
||
Policy loans and other invested assets |
|
|
|
|
|
- |
|
|
|
|
||
Total investments |
|
|
|
|
|
- |
|
|
|
|
||
Cash and cash equivalents |
|
|
|
|
|
- |
|
|
|
|
||
Accrued investment income |
|
|
|
|
|
- |
|
|
|
|
||
Reinsurance recoverables |
|
|
|
|
|
( |
) |
|
|
|
||
Deferred policy acquisition costs, net |
|
|
|
|
|
|
|
|
|
|||
Renewal commissions receivable |
|
|
|
|
|
- |
|
|
|
|
||
Agent balances, due premiums and other receivables |
|
|
|
|
|
- |
|
|
|
|
||
Goodwill |
|
|
|
|
|
- |
|
|
|
|
||
Intangible assets, net |
|
|
|
|
|
- |
|
|
|
|
||
Deferred income taxes |
|
|
|
|
|
( |
) |
|
|
|
||
Operating lease right-of-use assets |
|
|
|
|
|
- |
|
|
|
|
||
Other assets |
|
|
|
|
|
- |
|
|
|
|
||
Separate account assets |
|
|
|
|
|
- |
|
|
|
|
||
Total assets |
|
$ |
|
|
$ |
( |
) |
|
$ |
|
||
|
|
|
|
|
|
|
|
|
|
|||
Liabilities and Stockholders’ Equity: |
|
|
|
|
|
|
|
|
|
|||
Liabilities: |
|
|
|
|
|
|
|
|
|
|||
Future policy benefits |
|
$ |
|
|
$ |
( |
) |
|
$ |
|
||
Unearned and advance premiums |
|
|
|
|
|
- |
|
|
|
|
||
Policy claims and other benefits payable |
|
|
|
|
|
- |
|
|
|
|
||
Other policyholders’ funds |
|
|
|
|
|
- |
|
|
|
|
||
Note payable |
|
|
|
|
|
- |
|
|
|
|
||
Surplus note |
|
|
|
|
|
- |
|
|
|
|
||
Income tax payable |
|
|
|
|
|
- |
|
|
|
|
||
Deferred income taxes |
|
|
|
|
|
|
|
|
|
|||
Operating lease liabilities |
|
|
|
|
|
- |
|
|
|
|
||
Other liabilities |
|
|
|
|
|
- |
|
|
|
|
||
Payable under securities lending |
|
|
|
|
|
- |
|
|
|
|
||
Separate account liabilities |
|
|
|
|
|
- |
|
|
|
|
||
|
|
|
|
|
|
|
|
|
||||
Total liabilities |
|
|
|
|
|
( |
) |
|
|
|
||
|
|
|
|
|
|
|
|
|
|
|||
Temporary Stockholders’ Equity |
|
|
|
|
|
|
|
|
|
|||
Redeemable noncontrolling interests in consolidated entities |
|
|
- |
|
|
|
- |
|
|
|
- |
|
Permanent Stockholders’ Equity |
|
|
|
|
|
|
|
|
|
|||
Equity attributable to Primerica, Inc.: |
|
|
|
|
|
|
|
|
|
|||
Common stock ($ |
|
|
|
|
|
- |
|
|
|
|
||
Paid-in capital |
|
|
- |
|
|
|
- |
|
|
|
- |
|
Retained earnings |
|
|
|
|
|
|
|
|
|
|||
Accumulated other comprehensive income (loss), net of income tax: |
|
|
|
|
|
|
|
|
- |
|
||
Effect of change in discount rate assumptions on the liability for future policy benefits |
|
|
- |
|
|
|
|
|
|
|
||
Unrealized foreign currency translation gains (losses) |
|
|
( |
) |
|
|
( |
) |
|
|
( |
) |
Net unrealized investment gains (losses) on available-for-sale securities |
|
|
( |
) |
|
|
- |
|
|
|
( |
) |
Total permanent stockholders’ equity |
|
|
|
|
|
|
|
|
|
|||
|
$ |
|
|
$ |
( |
) |
|
$ |
|
|||
The impact of LDTI on the Company’s Previously Reported audited consolidated statements of income for the years ended December 31, 2022 and 2021 is as follows:
91
Consolidated Statements of Income |
|
|||||||||||||||||||||||
|
|
|
|
|
|
|
|
|
|
|
|
|
|
|
|
|
|
|
||||||
|
|
Year ended December 31, 2022 |
|
|
Year ended December 31, 2021 |
|
||||||||||||||||||
|
|
As Previously Reported |
|
|
Adoption Impacts |
|
|
As Adjusted |
|
|
As Previously Reported |
|
|
Adoption Impacts |
|
|
As Adjusted |
|
||||||
|
|
(In thousands except per-share amounts) |
|
|||||||||||||||||||||
Revenues: |
|
|
|
|
|
|
|
|
|
|
|
|
|
|
|
|
|
|
||||||
Direct premiums |
|
$ |
|
|
$ |
- |
|
|
$ |
|
|
$ |
|
|
$ |
- |
|
|
$ |
|
||||
Ceded premiums |
|
|
( |
) |
|
|
- |
|
|
|
( |
) |
|
|
( |
) |
|
|
- |
|
|
|
( |
) |
Net premiums |
|
|
|
|
|
- |
|
|
|
|
|
|
|
|
|
- |
|
|
|
|
||||
Commissions and fees |
|
|
|
|
|
- |
|
|
|
|
|
|
|
|
|
- |
|
|
|
|
||||
Investment income net of investment expenses |
|
|
|
|
|
- |
|
|
|
|
|
|
|
|
|
- |
|
|
|
|
||||
Interest expense on surplus note |
|
|
( |
) |
|
|
- |
|
|
|
( |
) |
|
|
( |
) |
|
|
- |
|
|
|
( |
) |
Net investment income |
|
|
|
|
|
- |
|
|
|
|
|
|
|
|
|
- |
|
|
|
|
||||
Realized investment gains (losses) |
|
|
|
|
|
- |
|
|
|
|
|
|
|
|
|
- |
|
|
|
|
||||
Other investment gains (losses) |
|
|
( |
) |
|
|
- |
|
|
|
( |
) |
|
|
|
|
|
- |
|
|
|
|
||
Investment gains (losses) |
|
|
( |
) |
|
|
- |
|
|
|
( |
) |
|
|
|
|
|
- |
|
|
|
|
||
Other, net |
|
|
|
|
|
- |
|
|
|
|
|
|
|
|
|
- |
|
|
|
|
||||
Total revenues |
|
|
|
|
|
- |
|
|
|
|
|
|
|
|
|
- |
|
|
|
|
||||
|
|
|
|
|
|
|
|
|
|
|
|
|
|
|
|
|
|
|
||||||
Benefits and expenses: |
|
|
|
|
|
|
|
|
|
|
|
|
|
|
|
|
|
|
||||||
Benefits and claims |
|
|
|
|
|
( |
) |
|
|
|
|
|
|
|
|
( |
) |
|
|
|
||||
Future policy benefits remeasurement (gain) loss |
|
|
- |
|
|
|
|
|
|
|
|
|
- |
|
|
|
|
|
|
|
||||
Amortization of deferred policy acquisition costs |
|
|
|
|
|
( |
) |
|
|
|
|
|
|
|
|
( |
) |
|
|
|
||||
Sales commissions |
|
|
|
|
|
- |
|
|
|
|
|
|
|
|
|
- |
|
|
|
|
||||
Insurance expenses |
|
|
|
|
|
- |
|
|
|
|
|
|
|
|
|
- |
|
|
|
|
||||
Insurance commissions |
|
|
|
|
|
- |
|
|
|
|
|
|
|
|
|
- |
|
|
|
|
||||
Contract acquisition costs |
|
|
|
|
|
- |
|
|
|
|
|
|
|
|
|
- |
|
|
|
|
||||
Interest expense |
|
|
|
|
|
- |
|
|
|
|
|
|
|
|
|
- |
|
|
|
|
||||
Goodwill impairment loss |
|
|
|
|
|
- |
|
|
|
|
|
|
|
|
|
- |
|
|
|
|
||||
Loss on extinguishment of debt |
|
|
- |
|
|
|
- |
|
|
|
- |
|
|
|
|
|
|
- |
|
|
|
|
||
Other operating expenses |
|
|
|
|
|
- |
|
|
|
|
|
|
|
|
|
- |
|
|
|
|
||||
Total benefits and expenses |
|
|
|
|
|
( |
) |
|
|
|
|
|
|
|
|
( |
) |
|
|
|
||||
Income before income taxes |
|
|
|
|
|
|
|
|
|
|
|
|
|
|
|
|
|
|
||||||
Income taxes |
|
|
|
|
|
|
|
|
|
|
|
|
|
|
|
|
|
|
||||||
Net income |
|
|
|
|
|
|
|
|
|
|
|
|
|
|
|
|
|
|
||||||
Net income (loss) attributable to noncontrolling interests |
|
|
( |
) |
|
|
- |
|
|
|
( |
) |
|
|
( |
) |
|
|
- |
|
|
|
( |
) |
Net income attributable to Primerica, Inc. |
|
$ |
|
|
$ |
|
|
$ |
|
|
$ |
|
|
$ |
|
|
$ |
|
||||||
|
|
|
|
|
|
|
|
|
|
|
|
|
|
|
|
|
|
|
||||||
Earnings per share attributable to common stockholders: |
|
|
|
|
|
|
|
|
|
|
|
|
|
|
|
|
|
|
||||||
Basic earnings per share |
|
$ |
|
|
$ |
|
|
$ |
|
|
$ |
|
|
$ |
|
|
$ |
|
||||||
Diluted earnings per share |
|
$ |
|
|
$ |
|
|
$ |
|
|
$ |
|
|
$ |
|
|
$ |
|
||||||
|
|
|
|
|
|
|
|
|
|
|
|
|
|
|
|
|
|
|
||||||
Weighted-average shares used in computing earnings |
|
|
|
|
|
|
|
|
|
|
|
|
|
|
|
|
|
|
||||||
Basic |
|
|
|
|
|
- |
|
|
|
|
|
|
|
|
|
- |
|
|
|
|
||||
|
|
|
|
|
- |
|
|
|
|
|
|
|
|
|
- |
|
|
|
|
|||||
Transition Impact on the Liability for Future Policy Benefits.
92
|
|
Transition Impact at January 1, 2021 |
|
|
|
|
(In thousands) |
|
|
Present Value of Expected Premiums |
|
Term Life |
|
|
Balance at December 31, 2020 |
|
$ |
|
|
Impact to retained earnings from capping Transition Date net premium ratio |
|
|
( |
) |
Balance at original discount rate |
|
|
|
|
Effect of changes in discount rate assumptions |
|
|
|
|
Balance at January 1, 2021 |
|
$ |
|
|
|
|
|
|
|
Present Value of Expected Future Policy Benefits |
|
|
|
|
Balance at December 31, 2020 |
|
$ |
|
|
Effect of changes in discount rate assumptions |
|
|
|
|
Balance at January 1, 2021 |
|
$ |
|
|
New Accounting Standards Not Yet Adopted.
Accounting standard |
Adoption date |
Description |
Effects on the financial statements |
Segment Reporting (Topic 280)— Improvements to Reportable Segment Disclosures ASU 2023-07 |
Annual periods beginning after December 15, 2023 and interim periods thereafter. Early adoption is permitted. Retrospective transition for all periods presented. |
In November 2023, the FASB issued the ASU to enhance segment disclosures. The amendments (1) require disclosure of significant segment expenses that are regularly provided to the chief operating decision maker (“CODM”) and included within each reported measure of segment profit or loss; (2) require disclosure of “other segment items” by reportable segment, which is the difference between segment revenue and significant segment expenses; (3) require annual segment disclosures to be included in interim financial statements; (4) clarify that if the CODM uses more than one measure of a segment’s profit or loss in assessing segment performance and deciding how to allocate resources, an entity may report one or more of those additional measures; and (5) require disclosure of the title and position of the CODM and an explanation of how the CODM uses the reported measure(s) of segment profit or loss in assessing segment performance and deciding how to allocate resources.
|
We do not believe the adoption of the standard will have a material impact on our consolidated financial statements. We will revise disclosures in accordance with the new standard in our annual 2024 financial statements and for interim periods thereafter. |
Income Taxes (Topic 740)—Improvements to Income Tax Disclosures ASU 2023-09 |
Annual periods beginning after December 15, 2024. Early adoption is permitted. Prospective transition, although retrospective transition is permitted. |
In December 2023, the FASB issued the ASU to increase income tax transparency through improvements primarily related to the existing rate reconciliation and income taxes paid disclosures. The amendments require (1) consistent categories and greater disaggregation of information in the rate reconciliation; and (2) income taxes paid disaggregated by jurisdiction.
The ASU also removes certain disclosure requirements, such as reasonably possible significant changes in the total amount of unrecognized tax benefits within 12 months of the reporting date. |
We do not believe the adoption of the standard will have a material impact on our consolidated financial statements. We will revise disclosures in accordance with the new standard in our annual 2025 financial statements. |
Recently-issued accounting guidance not discussed above is not applicable, is immaterial to our consolidated financial statements, or did not or is not expected to have a material impact on our business.
93
(2) Other Comprehensive Income
The components of other comprehensive income (“OCI”), including the income tax expense or benefit allocated to each component, were as follows:
|
|
Year ended December 31, |
|
|||||||||
|
|
2023 |
|
|
2022 |
|
|
2021 |
|
|||
|
|
(In thousands) |
|
|||||||||
Foreign currency translation adjustments: |
|
|
|
|
|
|
|
|
|
|||
Change in unrealized foreign currency translation gains (losses) |
|
$ |
|
|
$ |
( |
) |
|
$ |
|
||
Income tax expense (benefit) on unrealized foreign currency |
|
|
- |
|
|
|
- |
|
|
|
- |
|
Change in unrealized foreign currency translation gains |
|
$ |
|
|
$ |
( |
) |
|
$ |
|
||
Unrealized gain (losses) on available-for-sale securities: |
|
|
|
|
|
|
|
|
|
|||
Change in unrealized holding gains (losses) arising during |
|
$ |
|
|
$ |
( |
) |
|
$ |
( |
) |
|
Income tax expense (benefit) on unrealized holding gains |
|
|
|
|
|
( |
) |
|
|
( |
) |
|
Change in unrealized holding gains (losses) on available-for-sale |
|
|
|
|
|
( |
) |
|
|
( |
) |
|
|
|
|
|
|
|
|
|
|
|
|||
Reclassification from accumulated OCI to net income for (gains) |
|
|
|
|
|
( |
) |
|
|
( |
) |
|
Income tax (expense) benefit on (gains) losses reclassified from |
|
|
|
|
|
( |
) |
|
|
( |
) |
|
Reclassification from accumulated OCI to net income for (gains) |
|
|
|
|
|
( |
) |
|
|
( |
) |
|
Change in unrealized gains (losses) on available-for-sale |
|
$ |
|
|
$ |
( |
) |
|
$ |
( |
) |
|
Effect of change in discount rate assumptions on the LFPB: |
|
|
|
|
|
|
|
|
|
|||
Change in effect in discount rate assumptions on the LFPB before income taxes |
|
$ |
( |
) |
|
$ |
|
|
$ |
|
||
Income tax (expense) benefit on the effect of change in discount rate |
|
|
|
|
|
|
|
|
|
|||
assumptions on the LFPB from accumulated OCI to net income |
|
|
( |
) |
|
|
|
|
|
|
||
Change in effect in discount rate assumptions on the LFPB, net of income taxes |
|
$ |
( |
) |
|
$ |
|
|
$ |
|
||
(3) Segment and Geographical Information
Segments. We have
We also have a Corporate and Other Distributed Products segment, which consists primarily of revenues and expenses related to several discontinued lines of insurance other than our core term life insurance products and the distribution of various other financial products generally underwritten or offered by third-party providers. All of the Company’s net investment income is attributed to the Corporate and Other Distributed Products segment. In addition, interest expense incurred by the Company as well as gains and losses on our invested asset portfolio are entirely attributed to the Corporate and Other Distributed Products segment.
94
Notable information included in profit or loss by segment was as follows:
|
|
Year ended December 31, |
|
|||||||||
|
|
2023 |
|
|
2022 |
|
|
2021 |
|
|||
|
|
(In thousands) |
|
|||||||||
Revenues: |
|
|
|
|
|
|
|
|
|
|||
Term life insurance segment |
|
$ |
|
|
$ |
|
|
$ |
|
|||
Investment and savings products segment |
|
|
|
|
|
|
|
|
|
|||
Senior health segment |
|
|
|
|
|
|
|
|
|
|||
Corporate and other distributed products segment |
|
|
|
|
|
|
|
|
|
|||
Total revenues |
|
$ |
|
|
$ |
|
|
$ |
|
|||
|
|
|
|
|
|
|
|
|
|
|||
Net investment income: |
|
|
|
|
|
|
|
|
|
|||
Term life insurance segment |
|
$ |
- |
|
|
$ |
- |
|
|
$ |
- |
|
Investment and savings products segment |
|
|
- |
|
|
|
- |
|
|
|
- |
|
Senior health segment |
|
|
- |
|
|
|
- |
|
|
|
- |
|
Corporate and other distributed products segment |
|
|
|
|
|
|
|
|
|
|||
Total net investment income |
|
$ |
|
|
$ |
|
|
$ |
|
|||
|
|
|
|
|
|
|
|
|
|
|||
Amortization of DAC: |
|
|
|
|
|
|
|
|
|
|||
Term life insurance segment |
|
$ |
|
|
$ |
|
|
$ |
|
|||
Investment and savings products segment |
|
|
|
|
|
|
|
|
|
|||
Senior health segment |
|
|
- |
|
|
|
- |
|
|
|
- |
|
Corporate and other distributed products segment |
|
|
|
|
|
|
|
|
|
|||
Total amortization of DAC |
|
$ |
|
|
$ |
|
|
$ |
|
|||
|
|
|
|
|
|
|
|
|
|
|||
Non-cash share-based compensation expense: |
|
|
|
|
|
|
|
|
|
|||
Term life insurance segment |
|
$ |
|
|
$ |
|
|
$ |
|
|||
Investment and savings products segment |
|
|
|
|
|
|
|
|
|
|||
Senior health segment |
|
|
|
|
|
|
|
|
- |
|
||
Corporate and other distributed products segment |
|
|
|
|
|
|
|
|
|
|||
Total non-cash share-based compensation expense |
|
$ |
|
|
$ |
|
|
$ |
|
|||
|
|
|
|
|
|
|
|
|
|
|||
Income (loss) before income taxes: |
|
|
|
|
|
|
|
|
|
|||
Term life insurance segment |
|
$ |
|
|
$ |
|
|
$ |
|
|||
Investment and savings products segment |
|
|
|
|
|
|
|
|
|
|||
Senior health segment |
|
|
( |
) |
|
|
( |
) |
|
|
( |
) |
Corporate and other distributed products segment |
|
|
( |
) |
|
|
( |
) |
|
|
( |
) |
Total income (loss) before income taxes |
|
$ |
|
|
$ |
|
|
$ |
|
|||
Insurance expenses and other operating expenses directly attributable to the Term Life Insurance, Investment and Savings Products, and Senior Health segments are recorded directly to the applicable segment. We allocate certain other revenue and operating expenses that are not directly attributable to a specific operating segment using methods expected to reasonably measure the benefit received by each reporting segment. Such methods include time studies, recorded usage, revenue distribution, and sales force representative distribution. These allocated items include fees charged for access to Primerica Online (“POL”) and costs incurred for technology, sales force support, occupancy and other general and administrative costs. Costs that are not directly charged or allocated to our three primary operating segments are included in the Corporate and Other Distributed Products segment.
Total assets by segment were as follows:
|
|
December 31, 2023 |
|
|
December 31, 2022 |
|
|
December 31, 2021 |
|
|||
|
|
(In thousands) |
|
|||||||||
Assets: |
|
|
|
|
|
|
|
|
|
|||
Term life insurance segment |
|
$ |
|
|
$ |
|
|
$ |
|
|||
Investment and savings products segment (1) |
|
|
|
|
|
|
|
|
|
|||
Senior health segment |
|
|
|
|
|
|
|
|
|
|||
Corporate and other distributed products segment |
|
|
|
|
|
|
|
|
|
|||
Total assets |
|
$ |
|
|
$ |
|
|
$ |
|
|||
Assets specifically related to a segment are held in that segment. All invested assets held by the Company, including the deposit asset recognized in connection with our
95
supporting the segregated funds product in Canada are held in the Investment and Savings Products segment. Any remaining unallocated assets are reported in the Corporate and Other Distributed Products segment.
Geographical Information. Results of operations by country and long-lived assets — primarily tangible assets reported in other assets in our consolidated balance sheets —were as follows:
|
|
Year ended December 31, |
|
|||||||||
|
|
2023 |
|
|
2022 |
|
|
2021 |
|
|||
|
|
(In thousands) |
|
|||||||||
Revenues by country: |
|
|
|
|
|
|
|
|
|
|||
United States |
|
$ |
|
|
$ |
|
|
$ |
|
|||
Canada |
|
|
|
|
|
|
|
|
|
|||
Total revenues |
|
$ |
|
|
$ |
|
|
$ |
|
|||
|
|
December 31, 2023 |
|
|
December 31, 2022 |
|
|
December 31, 2021 |
|
|||
|
|
(In thousands) |
|
|||||||||
Long-lived assets by country: |
|
|
|
|
|
|
|
|
|
|||
United States |
|
$ |
|
|
$ |
|
|
$ |
|
|||
Canada |
|
|
|
|
|
|
|
|
|
|||
Other |
|
|
|
|
|
|
|
|
|
|||
Total long-lived assets |
|
$ |
|
|
$ |
|
|
$ |
|
|||
(4) Investments
AFS Securities.
|
|
December 31, 2023 |
|
|||||||||||||
|
|
Amortized cost |
|
|
Gross unrealized gains |
|
|
Gross unrealized losses |
|
|
Fair value |
|
||||
|
|
(In thousands) |
|
|||||||||||||
Securities available-for-sale, carried at fair value: |
|
|
|
|
|
|
|
|
|
|
|
|
||||
Fixed-maturity securities: |
|
|
|
|
|
|
|
|
|
|
|
|
||||
U.S. government and agencies |
|
$ |
|
|
$ |
|
|
$ |
( |
) |
|
$ |
|
|||
Foreign government |
|
|
|
|
|
|
|
|
( |
) |
|
|
|
|||
States and political subdivisions |
|
|
|
|
|
|
|
|
( |
) |
|
|
|
|||
Corporates |
|
|
|
|
|
|
|
|
( |
) |
|
|
|
|||
Residential mortgage-backed securities |
|
|
|
|
|
|
|
|
( |
) |
|
|
|
|||
Commercial mortgage-backed securities |
|
|
|
|
|
|
|
|
( |
) |
|
|
|
|||
Other asset-backed securities |
|
|
|
|
|
|
|
|
( |
) |
|
|
|
|||
Total fixed-maturity securities |
|
$ |
|
|
$ |
|
|
$ |
( |
) |
|
$ |
|
|||
Short-term investments |
|
|
|
|
|
- |
|
|
|
- |
|
|
|
|
||
Total fixed-maturity and short-term investments |
|
$ |
|
|
$ |
|
|
$ |
( |
) |
|
$ |
|
|||
|
|
December 31, 2022 |
|
|||||||||||||
|
|
Amortized cost |
|
|
Gross unrealized gains |
|
|
Gross unrealized losses |
|
|
Fair value |
|
||||
|
|
(In thousands) |
|
|||||||||||||
Securities available-for-sale, carried at fair value: |
|
|
|
|
|
|
|
|
|
|
|
|
||||
Fixed-maturity securities: |
|
|
|
|
|
|
|
|
|
|
|
|
||||
U.S. government and agencies |
|
$ |
|
|
$ |
|
|
$ |
( |
) |
|
$ |
|
|||
Foreign government |
|
|
|
|
|
|
|
|
( |
) |
|
|
|
|||
States and political subdivisions |
|
|
|
|
|
|
|
|
( |
) |
|
|
|
|||
Corporates |
|
|
|
|
|
|
|
|
( |
) |
|
|
|
|||
Residential mortgage-backed securities |
|
|
|
|
|
|
|
|
( |
) |
|
|
|
|||
Commercial mortgage-backed securities |
|
|
|
|
|
|
|
|
( |
) |
|
|
|
|||
Other asset-backed securities |
|
|
|
|
|
|
|
|
( |
) |
|
|
|
|||
Total fixed-maturity securities |
|
$ |
|
|
$ |
|
|
$ |
( |
) |
|
$ |
|
|||
Short-term investments |
|
|
|
|
|
|
|
|
( |
) |
|
|
|
|||
Total fixed-maturity and short-term investments |
|
$ |
|
|
$ |
|
|
$ |
( |
) |
|
$ |
|
|||
96
All of our AFS mortgage- and asset-backed securities represent beneficial interests in variable interest entities (“VIEs”). We are not the primary beneficiary of these VIEs because we do not have the power to direct the activities that most significantly impact the entities’ economic performance. The maximum exposure to loss as a result of our involvement in these VIEs equals the carrying value of the securities.
The scheduled maturity distribution of the AFS fixed-maturity securities portfolio as of December 31, 2023 was as follows:
|
|
Amortized cost |
|
|
Fair value |
|
||
|
|
(In thousands) |
|
|||||
Due in one year or less |
|
$ |
|
|
$ |
|
||
Due after one year through five years |
|
|
|
|
|
|
||
Due after five years through 10 years |
|
|
|
|
|
|
||
Due after 10 years |
|
|
|
|
|
|
||
|
|
|
|
|
|
|
||
Mortgage- and asset-backed securities |
|
|
|
|
|
|
||
Total AFS fixed-maturity securities |
|
$ |
|
|
$ |
|
||
Expected maturities may differ from scheduled contractual maturities because issuers of securities may have the right to call or prepay obligations with or without call or prepayment penalties.
Trading Securities.
|
|
December 31, 2023 |
|
|
December 31, 2022 |
|
||||||||||
|
|
Cost |
|
|
Fair value |
|
|
Cost |
|
|
Fair value |
|
||||
|
|
(In thousands) |
|
|||||||||||||
Fixed-maturity securities |
|
$ |
|
|
$ |
|
|
$ |
|
|
$ |
|
||||
Held-to-maturity Security. Concurrent with the execution of the Vidalia Re Coinsurance Agreement, Vidalia Re entered into a Surplus Note Purchase Agreement (the “Surplus Note Purchase Agreement”) with Hannover Life Reassurance Company of America and certain of its affiliates (collectively, “Hannover Re”) and a newly formed limited liability company (the “LLC”) owned by a third- party service provider. Under the Surplus Note Purchase Agreement, Vidalia Re issued a surplus note (the “Surplus Note”) to the LLC in exchange for a credit enhanced note from the LLC with an equal principal amount (the “LLC Note”). The principal amounts of the Surplus Note and the LLC Note have reached their peaks and are expected to decrease over time to coincide with the amount of policy reserves being contractually supported under the Vidalia Re Coinsurance Agreement. Both the LLC Note and the Surplus Note mature on
The LLC is a VIE as its owner does not have an equity investment at risk that is sufficient to permit the LLC to finance its activities without Vidalia Re or Hannover Re. The Parent Company, Primerica Life, and Vidalia Re share the power to direct the activities of the LLC with Hannover Re, but they do not have the obligation to absorb losses or the right to receive any residual returns related to the LLC’s primary risks or sources of variability. Through the credit enhancement feature, Hannover Re is the ultimate risk taker in this transaction and bears the obligation to absorb the LLC’s losses in the event of a Surplus Note default in exchange for the fee. Accordingly, the Company is not the primary beneficiary of the LLC and does not consolidate the LLC within its consolidated financial statements.
The LLC Note is classified as a held-to-maturity debt security in the Company’s invested asset portfolio as we have the positive intent and ability to hold the security until maturity. As of December 31, 2023, the LLC Note had an estimated unrealized holding loss of $
As of December 31, 2023,
Investments on Deposit with Governmental Authorities. As required by law, we have investments on deposit with governmental authorities and banks for the protection of policyholders. The fair value of investments on deposit was $
Securities Lending Transactions. We participate in securities lending transactions with broker-dealers and other financial institutions to increase investment income with minimal risk. We require minimum collateral on securities loaned equal to
97
Net Investment Income.
|
|
Year ended December 31, |
|
|
|||||||||
|
|
2023 |
|
|
2022 |
|
|
2021 |
|
|
|||
|
|
(In thousands) |
|||||||||||
Fixed-maturity securities (available-for-sale) |
|
$ |
|
|
$ |
|
|
$ |
|
|
|||
Fixed-maturity security (held-to-maturity) |
|
|
|
|
|
|
|
|
|
|
|||
Equity securities |
|
|
|
|
|
|
|
|
|
|
|||
Policy loans and other invested assets |
|
|
|
|
|
|
|
|
|
|
|||
Cash, cash equivalent and short-term investments |
|
|
|
|
|
|
|
|
|
|
|||
Total return on deposit asset underlying 10% coinsurance |
|
|
|
|
|
( |
) |
|
|
|
|
||
Gross investment income |
|
|
|
|
|
|
|
|
|
|
|||
Investment expenses |
|
|
( |
) |
|
|
( |
) |
|
|
( |
) |
|
Investment income net of investment expenses |
|
|
|
|
|
|
|
|
|
|
|||
Interest expense on surplus note |
|
|
( |
) |
|
|
( |
) |
|
|
( |
) |
|
Net investment income |
|
$ |
|
|
$ |
|
|
$ |
|
|
|||
The components of investment gains (losses), as well as details on gross realized investment gains (losses) and other investment gains (losses) were as follows:
|
|
Year ended December 31, |
|
|||||||||
|
|
2023 |
|
|
2022 |
|
|
2021 |
|
|||
|
|
(In thousands) |
|
|||||||||
Realized investment gains (losses): |
|
|
|
|
|
|
|
|
|
|||
Gross gains from sales of available-for-sale fixed maturity securities |
|
$ |
|
|
$ |
|
|
$ |
|
|||
Gross losses from sales of available-for-sale fixed maturity securities |
|
|
( |
) |
|
|
( |
) |
|
|
( |
) |
Net realized investment gains (losses): |
|
|
( |
) |
|
|
|
|
|
|
||
Other investment gains (losses): |
|
|
|
|
|
|
|
|
|
|||
Credit losses impairment of available-for-sale securities |
|
|
( |
) |
|
|
( |
) |
|
|
( |
) |
Market gains (losses) recognized in net income during the period on equity securities |
|
|
( |
) |
|
|
( |
) |
|
|
|
|
Gains (losses) from equity method investments |
|
|
|
|
|
- |
|
|
|
- |
|
|
Gains (losses) from bifurcated options |
|
|
|
|
|
- |
|
|
|
( |
) |
|
Gains (losses) on trading securities |
|
|
|
|
|
( |
) |
|
|
( |
) |
|
Other investment gains (losses): |
|
|
( |
) |
|
|
( |
) |
|
|
|
|
Investment gains (losses) |
|
$ |
( |
) |
|
$ |
( |
) |
|
$ |
|
|
The proceeds from sales or other redemptions of AFS securities were as follows:
|
|
Year ended December 31, |
|
|||||||||
|
|
2023 |
|
|
2022 |
|
|
2021 |
|
|||
|
|
(In thousands) |
|
|||||||||
Proceeds from sales or other redemptions |
|
$ |
|
|
$ |
|
|
$ |
|
|||
Accrued Interest.
Credit Losses for Available-for-sale Fixed-maturity Securities.
98
|
|
December 31, 2023 |
|
|||||||||||||
|
|
Less than 12 months |
12 months or longer |
|
||||||||||||
|
|
Fair value |
|
|
Unrealized losses |
|
|
Fair value |
|
|
Unrealized losses |
|
||||
|
|
(In thousands) |
|
|||||||||||||
Fixed-maturity securities: |
|
|
|
|
|
|
|
|
|
|
|
|
||||
U.S. government and agencies |
|
$ |
- |
|
|
$ |
- |
|
|
$ |
|
|
$ |
( |
) |
|
Foreign government |
|
|
|
|
|
( |
) |
|
|
|
|
|
( |
) |
||
States and political subdivisions |
|
|
|
|
|
( |
) |
|
|
|
|
|
( |
) |
||
Corporates |
|
|
|
|
|
( |
) |
|
|
|
|
|
( |
) |
||
Residential mortgage-backed securities |
|
|
|
|
|
( |
) |
|
|
|
|
|
( |
) |
||
Commercial mortgage-backed securities |
|
|
|
|
|
( |
) |
|
|
|
|
|
( |
) |
||
Other asset-backed securities |
|
|
|
|
|
( |
) |
|
|
|
|
|
( |
) |
||
Total fixed-maturity securities |
|
$ |
|
|
$ |
( |
) |
|
$ |
|
|
$ |
( |
) |
||
|
|
|
|
|
|
|
|
|
|
|
|
|
||||
|
|
December 31, 2022 |
|
|||||||||||||
|
|
Less than 12 months |
12 months or longer |
|
||||||||||||
|
|
Fair value |
|
|
Unrealized losses |
|
|
Fair value |
|
|
Unrealized losses |
|
||||
|
|
(In thousands) |
|
|||||||||||||
Fixed-maturity securities: |
|
|
|
|
|
|
|
|
|
|
|
|
||||
U.S. government and agencies |
|
$ |
|
|
$ |
( |
) |
|
$ |
|
|
$ |
( |
) |
||
Foreign government |
|
|
|
|
|
( |
) |
|
|
|
|
|
( |
) |
||
States and political subdivisions |
|
|
|
|
|
( |
) |
|
|
|
|
|
( |
) |
||
Corporates |
|
|
|
|
|
( |
) |
|
|
|
|
|
( |
) |
||
Residential mortgage-backed securities |
|
|
|
|
|
( |
) |
|
|
|
|
|
( |
) |
||
Commercial mortgage-backed securities |
|
|
|
|
|
( |
) |
|
|
|
|
|
( |
) |
||
Other asset-backed securities |
|
|
|
|
|
( |
) |
|
|
|
|
|
( |
) |
||
Total fixed-maturity securities |
|
|
|
|
|
( |
) |
|
|
|
|
|
( |
) |
||
Short-term investments: |
|
|
|
|
|
|
|
|
|
|
|
|
||||
U.S. government and agencies |
|
|
|
|
|
( |
) |
|
|
- |
|
|
|
- |
|
|
Foreign government |
|
|
|
|
|
( |
) |
|
|
- |
|
|
|
- |
|
|
Total Short Term Bonds |
|
|
|
|
|
( |
) |
|
|
- |
|
|
|
- |
|
|
Total fixed-maturity and Short Term securities |
|
$ |
|
|
$ |
( |
) |
|
$ |
|
|
$ |
( |
) |
||
The amortized cost of AFS securities with a cost basis in excess of their fair values were $
As of December 31, 2023 and 2022,
For the years ended December 31, 2023, 2022, and 2021, we recorded $
The rollforward of the allowance for credit losses on AFS securities was as follows:
|
|
Year ended December 31, |
|
|||||||||
|
|
2023 |
|
|
2022 |
|
|
2021 |
|
|||
|
|
(In thousands) |
|
|||||||||
Allowance for credit losses, beginning of period |
|
$ |
- |
|
|
$ |
|
|
$ |
- |
|
|
Additions to the allowance for credit losses on securities for which credit losses were not previously recorded |
|
|
- |
|
|
|
- |
|
|
|
|
|
Additional increases (decreases) to the allowance for credit losses on securities that had an allowance recorded in a previous period |
|
|
- |
|
|
|
( |
) |
|
|
( |
) |
Write-offs charged against the allowance, if any |
|
|
- |
|
|
|
( |
) |
|
|
- |
|
Allowance for credit losses, end of period |
|
$ |
- |
|
|
$ |
- |
|
|
$ |
|
|
99
Derivatives. We have a deferred loss related to closed forward contracts, which were settled several years ago, that were used to mitigate our exposure to foreign currency exchange rates that resulted from the net investment in our Canadian operations. The amount of deferred loss included in accumulated other comprehensive income (loss) was $
(5) Fair Value of Financial Instruments
Fair value is the price that would be received upon the sale of an asset or paid to transfer a liability in an orderly transaction between market participants at the measurement date. Invested assets recorded at fair value are measured and classified in accordance with a three-tier fair value hierarchy based on observable and unobservable inputs. Observable inputs reflect market data obtained from independent sources, while unobservable inputs reflect our view of market assumptions in the absence of observable market information. We classify and disclose all invested assets carried at fair value in one of the following three levels:
As of each reporting period, all assets and liabilities recorded at fair value are classified in their entirety based on the lowest level of input (Level 3 being the lowest in the hierarchy) that is significant to the fair value measurement. Significant levels of estimation and judgment are required to determine the fair value of certain of our investments. The factors influencing these estimations and judgments are subject to change in subsequent reporting periods.
The estimated fair value and hierarchy classifications for assets and liabilities that are measured at fair value on a recurring basis were as follows:
|
|
December 31, 2023 |
|
|||||||||||||
|
|
Level 1 |
|
|
Level 2 |
|
|
Level 3 |
|
|
Total |
|
||||
|
|
(In thousands) |
|
|||||||||||||
Fair value assets: |
|
|
|
|
|
|
|
|
|
|
|
|
||||
Available-for-sale fixed-maturity securities: |
|
|
|
|
|
|
|
|
|
|
|
|
||||
U.S. government and agencies |
|
$ |
- |
|
|
$ |
|
|
$ |
- |
|
|
$ |
|
||
Foreign government |
|
|
- |
|
|
|
|
|
|
- |
|
|
|
|
||
States and political subdivisions |
|
|
- |
|
|
|
|
|
|
- |
|
|
|
|
||
Corporates |
|
|
|
|
|
|
|
|
- |
|
|
|
|
|||
Mortgage-and asset-backed securities: |
|
|
|
|
|
|
|
|
|
|
|
|
||||
Residential mortgage-backed securities |
|
|
- |
|
|
|
|
|
|
- |
|
|
|
|
||
Commercial mortgage-backed securities |
|
|
- |
|
|
|
|
|
|
- |
|
|
|
|
||
Other asset-backed securities |
|
|
- |
|
|
|
|
|
|
|
|
|
|
|||
Total available-for-sale fixed-maturity securities |
|
|
|
|
|
|
|
|
|
|
|
|
||||
Short Term Investments |
|
|
- |
|
|
|
|
|
|
- |
|
|
|
|
||
Total available-for-sale securities |
|
|
|
|
|
|
|
|
|
|
|
|
||||
Equity securities |
|
|
|
|
|
|
|
|
|
|
|
|
||||
Trading securities |
|
|
- |
|
|
|
|
|
|
- |
|
|
|
|
||
Cash and cash equivalents |
|
|
|
|
|
- |
|
|
|
- |
|
|
|
|
||
Separate accounts |
|
|
- |
|
|
|
|
|
|
- |
|
|
|
|
||
Total fair value assets |
|
$ |
|
|
$ |
|
|
$ |
|
|
$ |
|
||||
Fair value liabilities: |
|
|
|
|
|
|
|
|
|
|
|
|
||||
Separate accounts |
|
$ |
- |
|
|
$ |
|
|
$ |
- |
|
|
$ |
|
||
Total fair value liabilities |
|
$ |
- |
|
|
$ |
|
|
$ |
- |
|
|
$ |
|
||
100
|
|
December 31, 2022 |
|
|||||||||||||
|
|
Level 1 |
|
|
Level 2 |
|
|
Level 3 |
|
|
Total |
|
||||
|
|
(In thousands) |
|
|||||||||||||
Fair value assets: |
|
|
|
|
|
|
|
|
|
|
|
|
||||
Available-for-sale fixed-maturity securities: |
|
|
|
|
|
|
|
|
|
|
|
|
||||
U.S. government and agencies |
|
$ |
- |
|
|
$ |
|
|
$ |
- |
|
|
$ |
|
||
Foreign government |
|
|
- |
|
|
|
|
|
|
- |
|
|
|
|
||
States and political subdivisions |
|
|
- |
|
|
|
|
|
|
- |
|
|
|
|
||
Corporates |
|
|
|
|
|
|
|
|
- |
|
|
|
|
|||
Mortgage-and asset-backed securities: |
|
|
|
|
|
|
|
|
|
|
|
|
||||
Residential mortgage-backed securities |
|
|
- |
|
|
|
|
|
|
- |
|
|
|
|
||
Commercial mortgage-backed securities |
|
|
- |
|
|
|
|
|
|
- |
|
|
|
|
||
Other asset-backed securities |
|
|
- |
|
|
|
|
|
|
- |
|
|
|
|
||
Total available-for-sale fixed-maturity securities |
|
|
|
|
|
|
|
|
- |
|
|
|
|
|||
Short Term Investments |
|
|
- |
|
|
|
|
|
|
- |
|
|
|
|
||
Total available-for-sale securities |
|
|
|
|
|
|
|
|
- |
|
|
|
|
|||
Equity securities |
|
|
|
|
|
|
|
|
|
|
|
|
||||
Trading securities |
|
|
- |
|
|
|
|
|
|
- |
|
|
|
|
||
Cash and cash equivalents |
|
|
|
|
|
- |
|
|
|
- |
|
|
|
|
||
Separate accounts |
|
|
- |
|
|
|
|
|
|
- |
|
|
|
|
||
Total fair value assets |
|
$ |
|
|
$ |
|
|
$ |
|
|
$ |
|
||||
Fair value liabilities: |
|
|
|
|
|
|
|
|
|
|
|
|
||||
Separate accounts |
|
$ |
- |
|
|
$ |
|
|
$ |
- |
|
|
$ |
|
||
Total fair value liabilities |
|
$ |
- |
|
|
$ |
|
|
$ |
- |
|
|
$ |
|
||
In estimating fair value of our investments, we use a third-party pricing service for approximately all of our securities that are measured at fair value on a recurring basis. The remaining securities are primarily thinly traded securities, such as private placements, and are valued using models based on observable inputs on public corporate spreads having similar characteristics (e.g., sector, average life and quality rating), liquidity and yield based on quality rating, average life and U.S. Treasury yields. All observable data inputs are corroborated by independent third-party data. We also corroborate pricing information provided by our third-party pricing service by performing a review of selected securities. Our review activities include obtaining detailed information about the assumptions, inputs and methodologies used in pricing the security; documenting this information; and corroborating it by comparison to independently obtained prices and or independently developed pricing methodologies.
Furthermore, we perform internal reasonableness assessments on fair value determinations within our portfolio throughout the year and as of year-end, including pricing variance analyses and comparisons to alternative pricing sources and benchmark returns. If a fair value appears unusual relative to these assessments, we will re-examine the inputs and may challenge a fair value assessment made by the pricing service. If there is a known pricing error, we will request a reassessment by the pricing service. If the pricing service is unable to perform the reassessment on a timely basis, we will determine the appropriate price by requesting a reassessment from an alternative pricing service or other qualified source as necessary. We do not adjust quotes or prices except in a rare circumstance to resolve a known error.
Because many fixed-maturity securities do not trade on a daily basis, third-party pricing services generally determine fair value using industry-standard methodologies, which vary by asset class. For corporates, governments, and agency securities, these methodologies include developing prices by incorporating available market information such as U.S. Treasury curves, benchmarking of similar securities including new issues, sector groupings, quotes from market participants and matrix pricing. Observable information is compiled and integrates relevant credit information, perceived market movements and sector news. Additionally, security prices are periodically back-tested to validate and/or refine models as conditions warrant. Market indicators and industry and economic events are also monitored as triggers to obtain additional data. For certain structured securities (such as mortgage- and asset-backed securities) with limited trading activity, third-party pricing services generally use industry-standard pricing methodologies that incorporate market information, such as index prices or discounting expected future cash flows based on underlying collateral, and quotes from market participants, to estimate fair value. If one or more of these input measures are not deemed observable for a particular security, the security will be classified as Level 3 in the fair value hierarchy.
Where specific market information is unavailable for certain securities, pricing models produce estimates of fair value primarily using Level 2 inputs along with certain Level 3 inputs. These models include matrix pricing. The pricing matrix uses current U.S. Treasury rates and credit spreads received from third-party sources to estimate fair value. The credit spreads incorporate the issuer’s industry- or issuer-specific credit characteristics and the security’s time to maturity, if warranted. Remaining unpriced securities are valued using an estimate of fair value based on indicative market prices that include significant unobservable inputs not based on, nor corroborated by, market information, including the utilization of non-binding broker quotes.
101
The roll-forward of the Level 3 assets measured at fair value on a recurring basis was as follows:
|
|
Year ended December 31, |
|
|||||
|
|
2023 |
|
|
2022 |
|
||
|
|
(In thousands) |
|
|||||
Level 3 assets, beginning of period |
|
$ |
|
|
$ |
|
||
|
|
- |
|
|
|
( |
) |
|
Realized gains (losses) and accretion (amortization) |
|
|
( |
) |
|
|
( |
) |
Purchases |
|
|
|
|
|
|
||
Sales |
|
|
- |
|
|
|
- |
|
Settlements |
|
|
- |
|
|
|
- |
|
Transfers into Level 3 |
|
|
- |
|
|
|
- |
|
Transfers out of Level 3 |
|
|
- |
|
|
|
( |
) |
Level 3 assets, end of period |
|
$ |
|
|
$ |
|
||
We obtain independent pricing quotes based on observable inputs as of the end of the reporting period for all securities in Level 2. Those inputs include benchmark yields, reported trades, broker/dealer quotes, issuer spreads, two-sided markets, benchmark securities, market bids/offers, quoted prices for similar instruments in markets that are not active, and other relevant data. We monitor these inputs for market indicators, industry and economic events. There were
The carrying values and estimated fair values of our financial instruments were as follows:
|
|
December 31, 2023 |
|
|
December 31, 2022 |
|
||||||||||
|
|
Carrying value |
|
|
Estimated fair value |
|
|
Carrying value |
|
|
Estimated fair value |
|
||||
|
|
(In thousands) |
|
|||||||||||||
Assets: |
|
|
|
|
|
|
|
|
|
|
|
|
||||
Fixed-maturity securities (available-for-sale) |
|
$ |
|
|
$ |
|
|
$ |
|
|
$ |
|
||||
Fixed-maturity security (held-to-maturity) (1) |
|
|
|
|
|
|
|
|
|
|
|
|
||||
Short-term investments (available-for-sale) |
|
|
|
|
|
|
|
|
|
|
|
|
||||
Equity securities |
|
|
|
|
|
|
|
|
|
|
|
|
||||
Trading securities |
|
|
|
|
|
|
|
|
|
|
|
|
||||
Policy loans (1) |
|
|
|
|
|
|
|
|
|
|
|
|
||||
Deposit asset underlying |
|
|
|
|
|
|
|
|
|
|
|
|
||||
Separate accounts |
|
|
|
|
|
|
|
|
|
|
|
|
||||
Liabilities: |
|
|
|
|
|
|
|
|
|
|
|
|
||||
Note payable (2) (3) |
|
|
|
|
|
|
|
|
|
|
|
|
||||
Surplus note (1) (2) |
|
|
|
|
|
|
|
|
|
|
|
|
||||
Separate accounts |
|
|
|
|
|
|
|
|
|
|
|
|
||||
The fair values of financial instruments presented above are estimates of the fair values at a specific point in time using various sources and methods, including market quotations and a complex matrix system that takes into account issuer sector, quality, and spreads in the current marketplace.
Financial Instruments Recognized at Fair Value in the Balance Sheets. Estimated fair values of investments in AFS securities are principally a function of current spreads and interest rates that are corroborated by independent third-party data. Therefore, the fair values presented are indicative of amounts we could realize or settle at the respective balance sheet date. We do not necessarily intend to dispose of or liquidate such instruments prior to maturity. Trading securities and equity securities, including common and nonredeemable preferred stocks, are carried at fair value. Segregated funds in separate accounts are carried at the underlying value of the variable insurance contracts, which is fair value.
The carrying amounts for cash and cash equivalents, trade receivables, accrued investment income, accounts payable, cash collateral and payables for security transactions approximate their fair values due to the short-term nature of these instruments. Consequently, such financial instruments are not included in the above table.
102
(6) Reinsurance
We use reinsurance extensively, which has a significant effect on our results of operations. Reinsurance arrangements do not relieve us of our primary obligation to the policyholder. Our reinsurance contracts typically do not have a fixed term. In general, the reinsurers’ ability to terminate coverage for existing cessions is limited to such circumstances as material breach of contract or nonpayment of premiums by the ceding company. Our reinsurance contracts generally contain provisions intended to provide the ceding company with the ability to cede future business on a basis consistent with historical terms. However, either party may terminate any of the contracts with respect to the future business upon appropriate notice to the other party. Generally, the reinsurance contracts do not limit the overall amount of the loss that can be incurred by the reinsurer.
Our policy is to limit the amount of life insurance retained on the life of any one person to $
Reinsurance recoverables represents ceded policy benefit reserve balances, ceded claim liabilities, and ceded claims paid that have not been reimbursed. The amounts of ceded claim liabilities included in reinsurance recoverables that we paid and which are recoverable from those reinsurers were $
In connection with our corporate reorganization that included an initial public offering (“IPO”) of our common stock by Citigroup, Inc. (“Citigroup”), Primerica Life, Primerica Life Canada and NBLIC entered into significant coinsurance transactions (the “IPO coinsurance agreements”) on March 30, 2010 with three insurance companies then affiliated with Citigroup (collectively, the “IPO coinsurers”). Under the IPO coinsurance agreements, we ceded between
Three of the IPO coinsurance agreements satisfy U.S. GAAP risk transfer rules. Under these agreements, we ceded between 80% and 90% of our term life future policy benefit reserves, and we transferred a corresponding amount of assets to the IPO coinsurers. These transactions did not impact our future policy benefit reserves. As such, we have recorded an asset for the same amount of risk transferred in reinsurance recoverables. We also reduced DAC by a corresponding amount, which reduces future amortization expenses. In addition, we are transferring between 80% and 90% of all future premiums and benefits and claims associated with these policies to the corresponding reinsurance entities. We receive ongoing ceding allowances, which are reflected as a reduction to insurance expenses, to cover policy and claims administration expenses as well as certain corporate overhead charges under each of these reinsurance contracts.
In the
The following table represents the Company’s in-force life insurance as of December 31, 2023 and 2022:
|
|
December 31, 2023 |
|
|
December 31, 2022 |
|
||
|
|
(Dollars in thousands) |
|
|||||
Direct life insurance in-force |
|
$ |
|
|
$ |
|
||
Amounts ceded to other companies |
|
|
( |
) |
|
|
( |
) |
Net life insurance in-force |
|
$ |
|
|
$ |
|
||
Percentage of reinsured life insurance in-force |
|
|
% |
|
|
% |
||
103
Reinsurance recoverables include ceded policy benefit reserve balances, ceded claim liabilities, and ceded claims paid that have not been reimbursed. The Company allocated reinsurance recoverables estimated at the cohort level to individual reinsurers for disclosure purposes. Reinsurance recoverables estimated by reinsurer and the financial strength ratings of those reinsurers were as follows:
|
|
December 31, 2023 |
|
December 31, 2022 |
||||||||
|
|
Reinsurance recoverables |
|
|
A.M. Best rating |
|
Reinsurance recoverables |
|
|
A.M. Best rating |
||
|
|
(In thousands) |
||||||||||
Swiss Re Life and Health America, Inc. (Novated from Pecan Re Inc.) (1) |
|
$ |
|
|
A+ |
|
$ |
|
|
A+ |
||
Munich Re of Malta (1) (2) |
|
|
|
|
N/R |
|
|
|
|
NR |
||
SCOR Global Life Reinsurance Companies (3) |
|
|
|
|
A |
|
|
|
|
A+ |
||
American Health and Life Insurance Company (1) |
|
|
|
|
B++ |
|
|
|
|
B++ |
||
Munich American Reassurance Company |
|
|
|
|
A+ |
|
|
|
|
A+ |
||
Swiss Re Life & Health America Inc. (4) |
|
|
|
|
A+ |
|
|
|
|
A+ |
||
RGA Reinsurance Company |
|
|
|
|
A+ |
|
|
|
|
A+ |
||
Korean Reinsurance Company |
|
|
|
|
A |
|
|
|
|
A |
||
All other reinsurers |
|
|
|
|
- |
|
|
|
|
- |
||
Allowance for credit losses |
|
|
( |
) |
|
|
|
|
( |
) |
|
|
Reinsurance recoverables |
|
$ |
|
|
|
|
$ |
|
|
|
||
NR – not rated by A.M. Best
(1)
Amounts shown are net of their share of the reinsurance receivable from other reinsurers. Arrangements with these reinsurers include collateral trust agreements
(2)
(3)
(4)
Certain reinsurers with which we do business receive group ratings. Individually, those reinsurers are SCOR Global Life Americas Reinsurance Company, SCOR Global Life U.S.A. Reinsurance Company, SCOR Global Life Re Insurance Company of Delaware, and SCOR Global Life of Canada.
The IPO coinsurance agreements include provisions to ensure that Primerica Life, Primerica Life Canada and NBLIC receive full regulatory credit for the reinsurance treaties. Under these agreements, the ceded business can be recaptured with no fee in the event the IPO coinsurers do not comply with the various safeguard provisions in their respective IPO coinsurance agreements. Pecan Re Inc. also has entered into a capital maintenance agreement requiring Swiss Re Life and Health America, Inc. to provide additional funding, if needed, at any point during the term of the agreement up to the maximum as described in the capital maintenance agreement.
The rollforward of the allowance for credit losses (“ACL”) on reinsurance recoverables for the years ended December 31, 2023, 2022, and 2021 were as follows:
|
|
Year ended December 31, |
|
|||||||||
|
|
2023 |
|
|
2022 |
|
|
2021 |
|
|||
|
|
(In thousands) |
|
|||||||||
Balance, beginning of period |
|
$ |
|
|
$ |
|
|
$ |
|
|||
Current period provision for expected credit losses |
|
|
|
|
|
|
|
|
|
|||
Writeoffs charged against the ACL, if any |
|
|
( |
) |
|
|
- |
|
|
|
( |
) |
Recoveries of amounts previously written off |
|
|
- |
|
|
|
( |
) |
|
|
( |
) |
Balance, at the end of period |
|
$ |
|
|
$ |
|
|
$ |
|
|||
(7) Deferred Policy Acquisition Costs
The balances and activity in DAC were as follows:
|
|
Year ended December 31, |
|
|||||||||||||
|
|
2023 |
|
|
2022 |
|
||||||||||
|
|
(In thousands) |
|
|||||||||||||
|
|
Term Life |
|
|
Segregated Funds (Canada) |
|
|
Term Life |
|
|
Segregated Funds (Canada) |
|
||||
DAC balance, beginning of period |
|
$ |
|
|
$ |
|
|
$ |
|
|
$ |
|
||||
Capitalization |
|
|
|
|
|
|
|
|
|
|
|
|
||||
Amortization |
|
|
( |
) |
|
|
( |
) |
|
|
( |
) |
|
|
( |
) |
Foreign exchange translation and other |
|
|
|
|
|
|
|
|
( |
) |
|
|
( |
) |
||
DAC balance, end of period |
|
$ |
|
|
$ |
|
|
$ |
|
|
$ |
|
||||
104
Reconciliation of DAC by product was as follows:
|
|
Year ended December 31, |
|
|||||
|
|
2023 |
|
|
2022 |
|
||
|
|
(In thousands) |
|
|||||
Term Life |
|
$ |
|
|
$ |
|
||
Segregated Funds (Canada) |
|
|
|
|
|
|
||
Other |
|
|
|
|
|
|
||
Total DAC, net |
|
$ |
|
|
$ |
|
||
(8) Separate Accounts
The following table represents the fair value of assets supporting separate accounts by major investment category:
|
|
Year ended December 31, |
|
|||||
|
|
2023 |
|
|
2022 |
|
||
|
|
(In thousands) |
|
|||||
Fixed-income securities |
|
$ |
|
|
$ |
|
||
Equity securities |
|
|
|
|
|
|
||
Cash and cash equivalents |
|
|
|
|
|
|
||
Due to/from funds |
|
|
( |
) |
|
|
( |
) |
Other |
|
|
|
|
|
|
||
Total separate account assets |
|
$ |
|
|
$ |
|
||
The following table represents the balances of and changes in separate account liabilities:
|
|
Year ended December 31, |
|
|||||
|
|
2023 |
|
|
2022 |
|
||
|
|
(In thousands) |
|
|||||
Separate account liabilities balance, beginning of period |
|
$ |
|
|
$ |
|
||
Premiums and deposits |
|
|
|
|
|
|
||
Surrenders and withdrawals |
|
|
( |
) |
|
|
( |
) |
Investment performance |
|
|
|
|
|
( |
) |
|
Management fees and other charges |
|
|
( |
) |
|
|
( |
) |
Foreign exchange translation |
|
|
|
|
|
( |
) |
|
Separate account liabilities balance, end of period |
|
$ |
|
|
$ |
|
||
Cash surrender value |
|
$ |
|
|
$ |
|
||
The cash surrender value represents the amount of the contract holders’ account balance distributable at the balance sheet date less the Company’s estimate of the deferred sales charges that would be assessed if the policyholders redeemed their contracts at the balance sheet date. This estimate requires the Company to make certain assumptions regarding the underlying account balances by contribution year and application of the contractually defined deferred sales charges that would be applicable to each contribution year.
(9) Policy Claims and Other Benefits Payable
Changes in policy claims and other benefits payable were as follows:
|
|
Year ended December 31, |
|
|||||
|
|
2023 |
|
|
2022 |
|
||
|
|
(In thousands) |
|
|||||
Policy claims and other benefits payable, beginning of period |
|
$ |
|
|
$ |
|
||
Less reinsured policy claims and other benefits payable |
|
|
|
|
|
|
||
Net balance, beginning of period |
|
|
( |
) |
|
|
( |
) |
Incurred related to current year |
|
|
|
|
|
|
||
Incurred related to prior years (1) |
|
|
( |
) |
|
|
( |
) |
Total incurred |
|
|
|
|
|
|
||
Claims paid related to current year, net of reinsured policy claims received |
|
|
( |
) |
|
|
( |
) |
Reinsured policy claims received related to prior years, net of claims paid |
|
|
|
|
|
|
||
Total paid |
|
|
( |
) |
|
|
( |
) |
Foreign currency translation |
|
|
|
|
|
( |
) |
|
Net balance, end of period |
|
|
( |
) |
|
|
( |
) |
Add reinsured policy claims and other benefits payable |
|
|
|
|
|
|
||
Balance, end of period |
|
$ |
|
|
$ |
|
||
105
(10) Future Policy Benefits
The following tables summarize balances and changes in the present value of expected net premiums and the present value of expected future policy benefits underlying the LFPB:
|
|
Year ended December 31, |
|
|||||
|
|
2023 |
|
|
2022 |
|
||
|
|
(Dollars in thousands) |
|
|||||
Present Value of Expected Net Premiums |
|
Term Life Insurance |
|
|||||
Balance at then current discount rate, beginning of period |
|
$ |
|
|
$ |
|
||
Balance at original discount rate, beginning of period |
|
|
|
|
|
|
||
Effect of changes in cash flow assumptions |
|
|
( |
) |
|
|
|
|
Effect of actual variances from expected experience |
|
|
( |
) |
|
|
|
|
Adjusted balance, beginning of period |
|
|
|
|
|
|
||
Issuances |
|
|
|
|
|
|
||
Interest accrual at original discount rate |
|
|
|
|
|
|
||
Net premiums collected |
|
|
( |
) |
|
|
( |
) |
Foreign currency translation |
|
|
|
|
|
( |
) |
|
Expected net premiums at original discount rate, end of period |
|
|
|
|
|
|
||
Effect of changes in discount rate assumptions |
|
|
( |
) |
|
|
( |
) |
Expected net premiums at then current discount rate, end of period |
|
$ |
|
|
$ |
|
||
|
|
|
|
|
|
|
||
Present Value of Expected Future Policy Benefits |
|
|
|
|||||
Balance at then current discount rate, beginning of period |
|
$ |
|
|
$ |
|
||
Balance at original discount rate, beginning of period |
|
|
|
|
|
|
||
Effect of changes in cash flow assumptions |
|
|
( |
) |
|
|
|
|
Effect of actual variances from expected experience |
|
|
( |
) |
|
|
|
|
Adjusted balance, beginning of period |
|
|
|
|
|
|
||
Issuances |
|
|
|
|
|
|
||
Interest Accrual at original discount rate |
|
|
|
|
|
|
||
Benefit payments |
|
|
( |
) |
|
|
( |
) |
Foreign currency translation |
|
|
|
|
|
( |
) |
|
Expected future policy benefits at original discount rate, end of period |
|
|
|
|
|
|
||
Effect of changes in discount rate assumptions |
|
|
|
|
|
( |
) |
|
Expected future policy benefits at then current discount rate, end of period |
|
$ |
|
|
$ |
|
||
|
|
|
|
|
|
|
||
LFPB |
|
$ |
|
|
$ |
|
||
Less: reinsurance recoverables |
|
|
|
|
|
|
||
Net LFPB, after reinsurance recoverables |
|
$ |
|
|
$ |
|
||
|
|
|
|
|
|
|
||
Weighted-average duration of net LFPB (in years) |
|
|
|
|
|
|
||
An annual review of our LFPB assumptions was performed during the third quarter of 2023 and included mortality, persistency, and disability rates (incidence and recovery rates for our waiver of premium rider). When reviewing assumptions, we used the Company’s own historical experience and considered quarterly cash flow variances by policy cohort. Judgment was also used when evaluating assumptions since prior historical experience was not fully reflective of future expected experience.
During the review, volatility in our experience studies was observed across all material assumptions, in large part due to the impact of the COVID-19 pandemic, and in the case of persistency, current economic trends. Mortality in excess of LFPB assumptions was experienced from 2020 to the first half of 2022 due to an increase in death claims caused by the COVID-19 pandemic. Conversely, mortality experienced in 2023 has been lower than expected compared to our LFPB assumptions, which may be due in part to a pull forward effect from the COVID-19 pandemic. Persistency rates were at historical highs during the COVID-19 pandemic and into the early part of 2022 and then regressed well below our LFPB assumptions after the pandemic subsided in 2022. In 2023, persistency rates have trended towards more historical levels but are still below our LFPB assumptions for certain issue year cohorts. When examining our term life waiver of premium benefit experience, we have noted that disability incidence rates have fallen since the COVID-19 pandemic and disability recovery rates have also experienced volatility.
We believe the recent fluctuations between actual experience and our LFPB assumptions was driven by the COVID-19 pandemic and its lingering impacts as well as economic conditions that have adversely impacted lapses. We believe the COVID-19 pandemic is a historically atypical event and not indicative of our long-term mortality, persistency and disability rate expectations and that economic
106
conditions will trend to historical norms over time. Therefore, we continue to believe our best estimate LFPB assumptions are represented by our pre-pandemic experience. In the short-term, we may continue to see experience variances due to volatility created by the trailing effects of the COVID-19 pandemic and economic conditions.
The only LFPB assumption that was changed during the year ended December 31, 2023 was shifting forward our assumption for long-term mortality improvement one year for applicable cohorts in our Term Life Insurance segment. We made a similar assumption change in 2022. The impact of this assumption change was immaterial to the measurement of the LFPB in both 2023 and 2022.
Discount rates, while a material assumption to our LFPB, are not part of the assumption-setting process since they are updated quarterly based on observable rates. There have been no changes with the compilation of data sources used for this input.
Losses recognized as a result of capping the net premium ratio at
The following table reconciles the LFPB to the consolidated balance sheets:
|
|
December 31, 2023 |
|
|
December 31, 2022 |
|
||
|
|
(In thousands) |
|
|||||
Term Life Insurance |
|
$ |
|
|
$ |
|
||
Other |
|
|
|
|
|
|
||
Total |
|
$ |
|
|
$ |
|
||
The following table reconciles the reinsurance recoverables to the consolidated balance sheets:
|
|
December 31, 2023 |
|
|
December 31, 2022 |
|
||
|
|
(In thousands) |
|
|||||
Term Life Insurance |
|
$ |
|
|
$ |
|
||
Other |
|
|
|
|
|
|
||
Total |
|
$ |
|
|
$ |
|
||
The amount of discounted (using the then current discount rate) and undiscounted expected gross premiums and expected future benefit payments were as follows:
|
December 31, 2023 |
|
|
December 31, 2022 |
|
||||||||||
|
(In thousands) |
|
|||||||||||||
Term Life Insurance |
|
|
|||||||||||||
|
Undiscounted |
|
|
Discounted |
|
|
Undiscounted |
|
|
Discounted |
|
||||
Expected future benefit payments |
$ |
|
|
$ |
|
|
$ |
|
|
$ |
|
||||
Expected future gross premiums |
$ |
|
|
$ |
|
|
$ |
|
|
$ |
|
||||
The amount of revenue and interest recognized in our consolidated statements of income were as follows:
|
Year ended December 31, |
|
|||||||||
|
2023 |
|
|
2022 |
|
|
2021 |
|
|||
|
(In thousands) |
|
|||||||||
Term Life Insurance |
|
|
|
|
|
||||||
Gross premiums |
$ |
|
|
$ |
|
|
$ |
|
|||
Interest accretion (expense) |
$ |
( |
) |
|
$ |
( |
) |
|
$ |
( |
) |
The weighted-average discount rates were as follows:
|
December 31, 2023 |
|
|
December 31, 2022 |
|
||
Term Life Insurance |
|
|
|||||
Original discount rate |
|
% |
|
|
% |
||
Current discount rate |
|
% |
|
|
% |
||
There were no changes to the methods used to determine the discount rates during the years ended December 31, 2023, 2022, and 2021.
107
(11) Debt
Notes Payable. Notes payable consisted of the following:
|
|
December 31, 2023 |
|
|
December 31, 2022 |
|
||
|
|
(In thousands) |
|
|||||
|
$ |
|
|
$ |
|
|||
Unamortized issuance discount on notes payable |
|
|
( |
) |
|
|
( |
) |
Total notes payable (1) |
|
$ |
|
|
$ |
|
||
As of December 31, 2023, we had outstanding $
As unsecured senior obligations, the Senior Notes rank equally in right of payment with all existing and future unsubordinated indebtedness and senior to all existing and future subordinated indebtedness of the Parent Company. The Senior Notes are structurally subordinated in right of payment to all existing and future liabilities of our subsidiaries. In addition, the Senior Notes contain covenants that restrict our ability to, among other things, create or incur any indebtedness that is secured by a lien on the capital stock of certain of our subsidiaries, and merge, consolidate or sell all or substantially all of our properties and assets.
Surplus Note. As of December 31, 2023, the principal amount outstanding on the Surplus Note issued by Vidalia Re was $
108
Revolving Credit Facility. On June 22, 2021, we amended and restated our unsecured $
(12) Income Taxes
Income tax expense. Income tax expense (benefit) consists of the following:
|
|
Current |
|
|
Deferred |
|
|
Total |
|
|||
|
|
(In thousands) |
|
|||||||||
Year ended December 31, 2023 |
|
|
|
|
|
|
|
|
|
|||
Federal |
|
$ |
|
|
$ |
( |
) |
|
$ |
|
||
Foreign |
|
|
|
|
|
( |
) |
|
|
|
||
State and local |
|
|
|
|
|
( |
) |
|
|
|
||
Total tax expense |
|
$ |
|
|
$ |
( |
) |
|
$ |
|
||
|
|
|
|
|
|
|
|
|
|
|||
Year ended December 31, 2022 |
|
|
|
|
|
|
|
|
|
|||
Federal |
|
$ |
|
|
$ |
( |
) |
|
$ |
|
||
Foreign |
|
|
|
|
|
( |
) |
|
|
|
||
State and local |
|
|
|
|
|
( |
) |
|
|
|
||
Total tax expense |
|
$ |
|
|
$ |
( |
) |
|
$ |
|
||
|
|
|
|
|
|
|
|
|
|
|||
Year ended December 31, 2021 |
|
|
|
|
|
|
|
|
|
|||
Federal |
|
$ |
|
|
$ |
|
|
$ |
|
|||
Foreign |
|
|
|
|
|
( |
) |
|
|
|
||
State and local |
|
|
|
|
|
( |
) |
|
|
|
||
Total tax expense |
|
$ |
|
|
$ |
|
|
$ |
|
|||
Income before income taxes. Income before income taxes by domestic and foreign were as follows:
|
|
Year ended December 31, |
|
|||||||||
|
|
2023 |
|
|
2022 |
|
|
2021 |
|
|||
|
|
(In thousands) |
|
|||||||||
Income before income taxes by domestic and foreign |
|
|
|
|
|
|
|
|
|
|||
Domestic |
|
$ |
|
|
$ |
|
|
$ |
|
|||
Foreign |
|
|
|
|
|
|
|
|
|
|||
Total income before income taxes |
|
$ |
|
|
$ |
|
|
$ |
|
|||
Effective tax rate reconciliation. Total income tax expense is different from the amount determined by multiplying income before income taxes by the U.S. statutory federal tax rate of
|
|
Year ended December 31, |
|
|||||||||||||||||||||
|
|
2023 |
|
|
2022 |
|
|
2021 |
|
|||||||||||||||
|
|
Amount |
|
|
Percentage |
|
|
Amount |
|
|
Percentage |
|
|
Amount |
|
|
Percentage |
|
||||||
|
|
(Dollars in thousands) |
|
|||||||||||||||||||||
Computed tax expense |
|
$ |
|
|
|
% |
|
$ |
|
|
|
% |
|
$ |
|
|
|
% |
||||||
Goodwill impairment loss |
|
|
- |
|
|
|
% |
|
|
|
|
|
% |
|
|
|
|
|
% |
|||||
Other |
|
|
|
|
|
% |
|
|
|
|
|
% |
|
|
|
|
|
% |
||||||
Total tax expense / |
|
$ |
|
|
|
% |
|
$ |
|
|
|
% |
|
$ |
|
|
|
% |
||||||
109
Deferred tax assets and liabilities. The main components of deferred income tax assets and liabilities were as follows:
|
|
December 31, |
|
|||||
|
|
2023 |
|
|
2022 |
|
||
|
|
(In thousands) |
|
|||||
Deferred tax assets: |
|
|
|
|
|
|
||
Future policy benefit reserves and unpaid policy claims |
|
$ |
|
|
$ |
|
||
Net operating loss and interest carryforwards |
|
|
|
|
|
|
||
Investments |
|
|
|
|
|
|
||
Future deductible liabilities |
|
|
|
|
|
|
||
Foreign tax credits |
|
|
|
|
|
|
||
Other |
|
|
|
|
|
|
||
Total deferred tax assets before valuation allowance |
|
|
|
|
|
|
||
Valuation allowance |
|
|
( |
) |
|
|
( |
) |
Total deferred tax assets after valuation allowance |
|
$ |
|
|
$ |
|
||
|
|
|
|
|
|
|
||
Deferred tax liabilities: |
|
|
|
|
|
|
||
Deferred policy acquisition costs |
|
$ |
( |
) |
|
$ |
( |
) |
Renewal commissions receivable |
|
|
( |
) |
|
|
( |
) |
Intangibles |
|
|
( |
) |
|
|
( |
) |
Reinsurance deposit asset |
|
|
( |
) |
|
|
( |
) |
Other |
|
|
( |
) |
|
|
( |
) |
Total deferred tax liabilities |
|
|
( |
) |
|
|
( |
) |
Net deferred tax assets (liabilities) |
|
$ |
|
|
$ |
( |
) |
|
The majority of total deferred tax assets are attributable to future policy benefit reserves and unpaid policy claims, which represents the difference between the financial statement carrying value and tax basis for liabilities related to future policy benefits. The tax basis for future policy benefit reserves and unpaid policy claims is actuarially determined in accordance with guidelines set forth in the respective jurisdictional tax codes in the U.S. and Canada. The majority of total deferred tax liabilities are attributable to DAC, which represents the difference between the policy acquisition costs capitalized for U.S. GAAP purposes and those capitalized for tax purposes, as well as the difference in the resulting amortization methods.
The Company has federal net operating losses resulting in a deferred tax asset of $
In assessing the realizability of deferred tax assets, management considers whether it is more likely than not that some portion or all of the deferred tax assets will not be realized. Management considers the scheduled reversal of deferred tax liabilities, projected future taxable income, carryback and carryforward periods, and tax planning strategies in making this assessment. As of December 31, 2023, management identified excess foreign tax credits of approximately $
Controlled foreign corporations. The Company has direct ownership of a group of controlled foreign corporations. The tax effects of controlled foreign corporations other than in Canada were not material. We have not made a permanent reinvestment assertion for any unremitted earnings in Canada; therefore, we have recorded a deferred tax liability to account for Canadian withholding taxes that will occur upon repatriation of such earnings and we continue to record deferred tax liabilities to account for Canadian withholding taxes as earnings are recognized.
The Company has no intentions to sell or substantially liquidate our Canadian operations and, therefore, has not provided for any additional outside basis difference for the amount of book basis in excess of tax basis in its Canadian subsidiaries. In addition, it is not practicable to determine the amount of the unrecognized deferred tax liability related to any additional outside basis difference in these entities.
Unrecognized tax benefits. The total amount of unrecognized benefits on uncertain tax positions that, if recognized, would affect our effective tax rate was approximately $
110
A reconciliation of the change in the unrecognized income tax benefit for the years ended December 31, 2023, 2022, and 2021 is as follows:
|
|
December 31, |
|
|||||||||
|
|
2023 |
|
|
2022 |
|
|
2021 |
|
|||
|
|
(In thousands) |
|
|||||||||
Unrecognized tax benefits, beginning of period |
|
$ |
|
|
$ |
|
|
$ |
|
|||
Change in prior period unrecognized tax benefits |
|
|
( |
) |
|
|
( |
) |
|
|
( |
) |
Change in current period unrecognized tax benefits |
|
|
|
|
|
|
|
|
|
|||
Reductions as a result of a lapse in statute of limitations |
|
|
( |
) |
|
|
( |
) |
|
|
( |
) |
Unrecognized tax benefits, end of period |
|
$ |
|
|
$ |
|
|
$ |
|
|||
We have an immaterial amount of penalties included in calculating our provision for income taxes. There is no significant change that is reasonably possible to occur within twelve months of the reporting date.
The major tax jurisdictions in which we operate are the United States and Canada. We are currently open to tax audit by the Internal Revenue Service for the year ended December 31, 2020 and thereafter for federal income tax purposes. We are currently open to audit in Canada for tax years ended December 31, 2019 and thereafter for federal and provincial income tax purposes.
Qualified investment tax credit projects. We have investments in various limited partnerships that sponsor qualified affordable housing projects, which meet the definition of a VIE. We are not the primary beneficiary of these VIEs because we do not have the power to direct the activities that most significantly impact the entities’ economic performance. The maximum exposure to loss as a result of our involvement in these VIEs equals the carrying value of the investments. The primary economic purpose of these investments is to achieve a satisfactory return on capital through the receipt of tax credits. Our qualified affordable housing project investments are accounted for using the proportional amortization method of accounting. During the year ended December 31, 2023 and 2022, the amount of income tax benefits recognized from these investments was insignificant.
Our investment in qualified affordable housing projects was $
During the year ended December 31, 2023, we invested in a limited partnership that constructed and operates a solar energy generation facility (“Solar Farm”), which meets the definition of a VIE. We are not the primary beneficiary of this VIE because we do not have the power to direct the activities that most significantly impact the entity's economic performance. The maximum exposure to loss from our involvement in this VIE equals the carrying value of the investment. The primary economic purpose of this investment is to achieve a satisfactory return on capital through the receipt of tax credits and other tax attributes. Our investment in the Solar Farm is accounted for using the equity method of accounting. As of December 31, 2023, the carrying amount of our investment in the Solar Farm was $
(13) Stockholders’ Equity
The following table shows changes in our outstanding common stock:
|
|
Year ended December 31, |
|
|||||||||
|
|
2023 |
|
|
2022 |
|
|
2021 |
|
|||
|
|
(In thousands) |
|
|||||||||
Common stock, beginning of period |
|
|
|
|
|
|
|
|
|
|||
Shares of common stock issued upon exercise of stock options |
|
|
|
|
|
- |
|
|
|
|
||
Shares of common stock issued when sales restrictions on RSUs lapsed and PSUs were earned |
|
|
|
|
|
|
|
|
|
|||
Common stock retired |
|
|
( |
) |
|
|
( |
) |
|
|
( |
) |
Common stock, end of period |
|
|
|
|
|
|
|
|
|
|||
The above table excludes RSUs and PSUs, which do not have voting rights. As sales restrictions on RSUs lapse and PSUs are earned, we issue common shares with voting rights. As of December 31, 2023, we had a total of
111
On November 17, 2022, our Board of Directors authorized a share repurchase program for up to $
(14) Earnings Per Share
The Company has outstanding common stock and equity awards that consist of RSUs and PSUs. All outstanding stock options were exercised during the year ended December 31, 2023. The RSUs maintain non-forfeitable dividend rights that result in dividend payment obligations on a one-to-one ratio with common shares for any future dividend declarations.
Unvested RSUs are deemed participating securities for purposes of calculating EPS as they maintain dividend rights. We calculate EPS using the two-class method. Under the two-class method, we allocate earnings to common shares and vested RSUs outstanding for the period. Earnings attributable to unvested participating securities, along with the corresponding share counts, are excluded from EPS as reflected in our consolidated statements of income.
In calculating basic EPS, we deduct from net income any dividends and undistributed earnings allocated to unvested RSUs and then divide the result by the weighted-average number of common shares and vested RSUs outstanding for the period.
We determine the potential dilutive effect of PSUs and stock options outstanding (“contingently-issuable shares”) on EPS using the treasury-stock method. Under this method, we determine the proceeds that would be received from the issuance of the contingently- issuable shares if the end of the reporting period were the end of the contingency period. The proceeds from the contingently-issuable shares include the remaining unrecognized compensation expense of the awards and the cash received for the exercise price on stock options. We then use the average market price of our common shares during the period the contingently-issuable shares were outstanding to determine how many shares we could repurchase with the proceeds raised from the issuance of the contingently-issuable shares. The net incremental share count issued represents the potential dilutive securities. We then reallocate earnings to common shares and vested RSUs by incorporating the increased fully-diluted share count to determine diluted EPS.
The calculation of basic and diluted EPS was as follows:
|
|
Year ended December 31, |
|
|||||||||
|
|
2023 |
|
|
2022 |
|
|
2021 |
|
|||
|
(In thousands, except per-share amounts) |
|
||||||||||
Basic EPS: |
|
|
|
|
|
|
|
|
|
|||
Numerator: |
|
|
|
|
|
|
|
|
|
|||
Net income attributable to Primerica, Inc. |
|
$ |
|
|
$ |
|
|
$ |
|
|||
Income attributable to unvested participating securities |
|
|
( |
) |
|
|
( |
) |
|
|
( |
) |
Net income used in calculating basic EPS |
|
$ |
|
|
$ |
|
|
$ |
|
|||
Denominator: |
|
|
|
|
|
|
|
|
|
|||
Weighted-average vested shares |
|
|
|
|
|
|
|
|
|
|||
Basic EPS |
|
$ |
|
|
$ |
|
|
$ |
|
|||
|
|
|
|
|
|
|
|
|
|
|||
Diluted EPS: |
|
|
|
|
|
|
|
|
|
|||
Numerator: |
|
|
|
|
|
|
|
|
|
|||
Net income attributable to Primerica, Inc. |
|
$ |
|
|
$ |
|
|
$ |
|
|||
Income attributable to unvested participating securities |
|
|
( |
) |
|
|
( |
) |
|
|
( |
) |
Net income used in calculating diluted EPS |
|
$ |
|
|
$ |
|
|
$ |
|
|||
Denominator: |
|
|
|
|
|
|
|
|
|
|||
Weighted-average vested shares |
|
|
|
|
|
|
|
|
|
|||
Dilutive effect of incremental shares to be issued for |
|
|
|
|
|
|
|
|
|
|||
Weighted-average shares used in calculating diluted EPS |
|
|
|
|
|
|
|
|
|
|||
Diluted EPS |
|
$ |
|
|
$ |
|
|
$ |
|
|||
(15) Share-Based Transactions
The Company has outstanding equity awards under the Primerica, Inc. Second Amended and Restated 2010 Omnibus Incentive Plan (“2010 OIP”), which expired in 2020 in accordance with its terms and under which no future awards will be made, and the Primerica, Inc. 2020 Omnibus Incentive Plan (the “2020 OIP”, and together with the 2010 OIP, the “OIP”), which was approved by the Company’s stockholders on May 13, 2020. The OIP provides for the issuance of equity awards, including stock options, stock appreciation rights, restricted stock, deferred stock, RSUs, PSUs, and stock payment awards, as well as cash-based awards. In addition to time-based vesting requirements, awards granted under the OIP may also be subject to specified performance criteria. Under the OIP, the Company issues equity awards to our management (officers and other key employees), non-employees who served on our
112
Board of Directors, and sales force leaders. As of December 31, 2023, we had
Employee and Director Share-Based Compensation. As of December 31, 2023, the Company had outstanding RSUs and PSUs issued to our management (officers and other key employees), as well as RSUs issued to our directors, under the OIP.
RSUs.
All of our outstanding employee and director RSU awards are eligible for dividend equivalents regardless of vesting status.
We recognized expense and tax benefit offsets as follows for employee and director RSU share-based compensation:
|
|
Year ended December 31, |
|
|||||||||
|
|
2023 |
|
|
2022 |
|
|
2021 |
|
|||
|
|
(In thousands) |
|
|||||||||
Total equity awards expense recognized |
|
$ |
|
|
$ |
|
|
$ |
|
|||
Tax benefit associated with total employee and director |
|
|
|
|
|
|
|
|
|
|||
The following table summarizes employee and director RSU activity during the years ended December 31, 2023, 2022, and 2021.
|
|
Shares |
|
|
Weighted-average measurement-date fair value per share |
|
||
|
|
(Shares in thousands) |
|
|||||
Unvested employee and director RSUs, December 31, 2020 |
|
|
|
|
$ |
|
||
Granted |
|
|
|
|
|
|
||
Forfeited |
|
|
( |
) |
|
|
|
|
Vested |
|
|
( |
) |
|
|
|
|
Unvested employee and director RSUs, December 31, 2021 |
|
|
|
|
|
|
||
Granted |
|
|
|
|
|
|
||
Forfeited |
|
|
( |
) |
|
|
|
|
Vested |
|
|
( |
) |
|
|
|
|
Unvested employee and director RSUs, December 31, 2022 |
|
|
|
|
|
|
||
Granted |
|
|
|
|
|
|
||
Forfeited |
|
|
( |
) |
|
|
|
|
Vested |
|
|
( |
) |
|
|
|
|
Unvested employee and director RSUs, December 31, 2023 |
|
|
|
|
|
|
||
As of December 31, 2023, total compensation cost not yet recognized in our consolidated financial statements related to employee and director RSU awards with time-based vesting conditions yet to be reached was $
PSUs.
The Company issued PSUs to certain of its executive officers under the OIP as part of their annual equity compensation. To date, PSU awards have included a performance target of a specified average annual Return on Adjusted Equity (“ROAE”) and EPS growth (starting with the 2020 award) for the Company over a
PSU awards provide for vesting upon the voluntary termination of employment by any employee who is “retirement eligible” as of his or her termination date. The number of shares that will be earned for a retirement-eligible employee is equal to the amount calculated using the Company’s actual performance metrics for the entire performance period, even if that employee retires prior to the completion of the performance period.
113
In connection with our granting of PSU awards, we recognized expense and tax benefit offsets as follows:
|
|
Year ended December 31, |
|
|||||||||
|
|
2023 |
|
|
2022 |
|
|
2021 |
|
|||
|
|
(In thousands) |
|
|||||||||
Total employee PSU award expense |
|
$ |
|
|
$ |
|
|
$ |
|
|||
Tax benefit associated with total employee PSU award expense |
|
|
- |
|
|
|
- |
|
|
|
- |
|
The following table summarizes PSU activity during the years ended December 31, 2023, 2022, and 2021.
|
|
Shares |
|
|
Weighted-average measurement-date fair value per share |
|
||
|
|
(Shares in thousands) |
|
|||||
Unvested employee PSUs, December 31, 2020(1) |
|
|
|
|
$ |
|
||
Granted |
|
|
|
|
|
|
||
Forfeited |
|
|
- |
|
|
|
- |
|
Performance Adjustment |
|
|
|
|
|
|
||
Vested |
|
|
( |
) |
|
|
|
|
Unvested employee PSUs, December 31, 2021(1) |
|
|
|
|
|
|
||
Granted |
|
|
|
|
|
|
||
Forfeited |
|
|
- |
|
|
|
- |
|
Performance Adjustment |
|
|
|
|
|
|
||
Vested |
|
|
( |
) |
|
|
|
|
Unvested employee PSUs, December 31, 2022(1) |
|
|
|
|
|
|
||
Granted |
|
|
|
|
|
|
||
Forfeited |
|
|
- |
|
|
|
- |
|
Performance Adjustment |
|
|
( |
) |
|
|
|
|
Vested |
|
|
( |
) |
|
|
|
|
Unvested employee PSUs, December 31, 2023(1) |
|
|
|
|
|
|
||
As of December 31, 2023 the Company did
Stock Options. From 2013 to 2016, the Company issued stock options to certain of its executive officers under the OIP as part of their annual equity compensation. Stock options were granted with an exercise price equal to the fair market value of our common stock on the grant date, and they expire
The following table summarizes activity related to stock options outstanding and exercisable during the years ended December 31, 2023, 2022, and 2021:
|
|
Outstanding |
|
|
Exercisable |
|
||||||||||
|
|
Number of shares |
|
|
Weighted average exercise price |
|
|
Number of shares |
|
|
Weighted average exercise price |
|
||||
|
|
(Shares in thousands) |
|
|||||||||||||
Outstanding at December 31, 2020 |
|
|
|
|
$ |
|
|
|
|
|
$ |
|
||||
Granted |
|
|
- |
|
|
|
- |
|
|
|
|
|
|
|
||
Exercised |
|
|
( |
) |
|
|
|
|
|
|
|
|
|
|||
Outstanding at December 31, 2021 |
|
|
|
|
|
|
|
|
|
|
|
|
||||
Granted |
|
|
- |
|
|
|
- |
|
|
|
|
|
|
|
||
Exercised |
|
|
- |
|
|
|
- |
|
|
|
|
|
|
|
||
Outstanding at December 31, 2022 |
|
|
|
|
|
|
|
|
|
|
|
|
||||
Granted |
|
|
- |
|
|
|
- |
|
|
|
|
|
|
|
||
Exercised |
|
|
( |
) |
|
|
|
|
|
- |
|
|
|
- |
|
|
Outstanding at December 31, 2023 |
|
|
- |
|
|
|
- |
|
|
|
- |
|
|
|
- |
|
The intrinsic value, tax benefit realized and value of shares withheld related to option exercise activity are summarized as follows:
114
|
|
Year ended December 31, |
|
|||||||||
|
|
2023 |
|
|
2022 |
|
|
2021 |
|
|||
|
|
(In thousands) |
|
|||||||||
Intrinsic value of options exercised |
|
$ |
|
|
$ |
- |
|
|
$ |
|
||
Tax benefit realized from the options exercised |
|
|
- |
|
|
|
- |
|
|
|
- |
|
Value of issued shares withheld to satisfy option |
|
|
|
|
|
- |
|
|
|
|
||
Non-Employee Share-Based Compensation. Non-employee share-based transactions relate to the granting of RSUs to members of the sales force (“agent equity awards”). Agent equity awards are generally granted as a part of quarterly contests for successful life insurance policy acquisitions and for sales of investment and savings products for which the grant and the service period occur within the same quarterly reporting period.
The following table summarizes non-employee RSU activity during the years ended December 31, 2023, 2022, and 2021.
|
|
Shares |
|
|
Weighted-average measurement-date fair value per share |
|
||
|
|
(Shares in thousands) |
|
|||||
Unvested non-employee RSUs, December 31, 2020 |
|
|
|
|
$ |
|
||
Granted |
|
|
|
|
|
|
||
Vested |
|
|
( |
) |
|
|
|
|
Unvested non-employee RSUs, December 31, 2021 |
|
|
|
|
|
|
||
Granted |
|
|
|
|
|
|
||
Vested |
|
|
( |
) |
|
|
|
|
Unvested non-employee RSUs, December 31, 2022 |
|
|
|
|
|
|
||
Granted |
|
|
|
|
|
|
||
Vested |
|
|
( |
) |
|
|
|
|
Unvested non-employee RSUs, December 31, 2023 |
|
|
|
|
|
|
||
Agent equity awards are measured using the fair market value at the grant date and vest during the service period, which occur within the same quarterly reporting period.
To the extent that these awards are an incremental direct cost of successful acquisitions of life insurance policies that result directly from and are essential to the policy acquisition(s) and would not have been incurred had the policy acquisition(s) not occurred, we defer and amortize the fair value of the awards in the same manner as other deferred policy acquisition costs. All agent equity awards that are not directly related to the acquisition of life insurance policies are recognized as expense in the quarter granted and earned.
Details on the granting and valuation of these awards were as follows:
|
|
Year ended December 31, |
|
|||||||||
|
|
2023 |
|
|
2022 |
|
|
2021 |
|
|||
|
|
(In thousands) |
|
|||||||||
Quarterly incentive awards expense recognized currently |
|
$ |
|
|
$ |
|
|
$ |
|
|||
Quarterly incentive awards expense deferred |
|
|
|
|
|
|
|
|
|
|||
Tax benefit associated with incentive awards |
|
|
|
|
|
|
|
|
|
|||
As of December 31, 2023, all agent equity awards were fully vested with the exception of approximately
(16) Statutory Accounting and Dividend Restrictions
U.S. Insurance Subsidiaries. Our two underwriting U.S. insurance subsidiaries are Primerica Life and NBLIC. Primerica Life wholly owns Peach Re and Vidalia Re, and ceded to each in separate coinsurance arrangements certain level-premium term life insurance policies.
Our U.S. insurance subsidiaries are required to report their results of operations and financial position to state authorities on the basis of statutory accounting practices prescribed or permitted by such authorities and the National Association of Insurance Commissioners (“NAIC”), which is a comprehensive basis of accounting other than U.S. GAAP. Prescribed statutory accounting practices include a variety of publications of the NAIC, as well as state laws, regulations and general administrative rules. Permitted statutory accounting practices encompass all accounting practices not so prescribed. The Company’s principal life insurance company, Primerica Life, prepares its statutory financial statements on the basis of accounting practices prescribed or permitted by the NAIC and the Tennessee Department of Commerce and Insurance (“Tennessee DOCI”) and includes the statutory financial statements of its wholly owned insurance subsidiaries, NBLIC, Peach Re, and Vidalia Re. NBLIC’s statutory financial statements are prepared on the basis of accounting practices prescribed or permitted by the NAIC or the New York State Department of Financial Services, while the statutory financial statements of Peach Re and Vidalia Re are prepared on the basis of accounting practices prescribed or permitted by
115
the NAIC or the Vermont Department of Financial Regulation (“Vermont DOI”). Our U.S. insurance subsidiaries’ ability to pay dividends to their parent is subject to and limited by the various laws and regulations of their respective states. There are no regulatory restrictions on the ability of the Parent Company to pay dividends (other than limitations under the Delaware General Corporation Law that provide that dividends on common stock shall be declared by the Board of Directors out of surplus or, if there is no surplus, out of net profits for the fiscal year in which the dividend is declared and/or the preceding prior fiscal year).
Primerica Life’s statutory ordinary dividend capacity is based on the greater of: (1) the previous year’s statutory net gain from operations (excluding pro rata distributions of any class of the insurer’s own securities) or (2) 10% of the previous year-end statutory surplus (net of capital stock). Dividends that, together with the amount of other distributions or dividends made within the preceding 12 months, exceed this statutory limitation are referred to as extraordinary dividends and require advance notice to the Tennessee DOCI, and are subject to potential disapproval. Dividends paid from other than statutory unassigned surplus require approval of the commissioner of the Tennessee DOCI.
Primerica Life’s statutory capital and surplus as of December 31, 2023 and 2022 were as follows:
|
|
December 31, 2023 |
|
|
December 31, 2022 |
|
||
|
|
(In thousands) |
|
|||||
Statutory capital and surplus |
|
$ |
|
|
$ |
|
||
Primerica Life’s statutory net gain from operations was $
Primerica Life’s investment basis in NBLIC, Peach Re, and Vidalia Re reflect their statutory capital and surplus amounts recorded in accordance with statutory accounting practices prescribed or permitted by the NAIC and/or each subsidiary’s state of domicile; New York and Vermont. Peach Re was formed as a special-purpose financial captive insurance company and, with the explicit permission of the Vermont DOI, has included the value of a letter of credit serving as collateral for its policy reserves as an admitted asset in its statutory capital and surplus. This permitted accounting practice was critical to the organization and operational plans of Peach Re and explicitly included in the licensing order issued by the Vermont DOI. The impact of this permitted practice as of December 31, 2023 was $
Canadian Insurance Subsidiary. Primerica Life Canada is incorporated under the provisions of the Canada Business Corporations Act and is a domiciled Canadian Company subject to regulation under the Insurance Companies Act (Canada) by the Office of the Superintendent of Financial Institutions in Canada (“OSFI”) and by Provincial Superintendents of Financial Institutions/Insurance in those provinces in which Primerica Life Canada is licensed. The statutory financial statements of Primerica Life Canada reported to OSFI are prepared in accordance with International Financial Reporting Standards (“IFRS”).
Primerica Life Canada’s capacity to pay ordinary dividends to its parent is limited by OSFI regulations to the extent that its capital exceeds internal capital targets. OSFI requires companies to set internal target levels of capital sufficient to provide for all the risks of the insurer, including risks specified in OSFI’s capital guidelines. As of December 31, 2023 and 2022, Primerica Life Canada’s statutory capital and surplus satisfied regulatory requirements and was $
In Canada, dividends can typically be paid subject to the paying insurance company continuing to have adequate capital and forms of liquidity as defined by OSFI following the dividend payment and upon 15 days minimum notice to OSFI. Primerica Life Canada’s dividend capacity at January 1, 2024 was estimated to be $
(17) Commitments and Contingent Liabilities
Letter of Credit (“LOC”). Peach Re maintained a Credit Facility Agreement with Deutsche Bank (the “Credit Facility Agreement”) to support certain obligations for a portion of the reserves (commonly referred to as Regulation XXX reserves) related to level premium term life insurance policies ceded to Peach Re from Primerica Life under the Peach Re Coinsurance Agreement.
Under the Credit Facility Agreement, Deutsche Bank issued a letter of credit in the initial amount of $
116
conditions, the amount of the LOC periodically increased up to a maximum amount of approximately $
Contingent Liabilities. The Company is involved from time-to-time in legal disputes, regulatory inquiries and arbitration proceedings in the normal course of business. These disputes are subject to uncertainties, including the large and/or indeterminate amounts sought in certain of these matters and the inherent unpredictability of litigation. As such, the Company is unable to estimate the possible loss or range of loss that may result from these matters unless otherwise indicated.
(18) Benefit Plans
We sponsor defined contribution plans for the benefit of our employees. The expense associated with these plans was approximately $
(19) Revenue from Contracts with Customers
Our revenues from contracts with customers primarily include:
Premiums from insurance contracts we underwrite, fees received from segregated funds insurance contracts, and income earned on our invested assets are excluded from the definition of revenues from contracts with customers in accordance with U.S. GAAP.
117
The disaggregation of our revenues from contracts with customers were as follows:
|
|
Year ended December 31, |
|
|||||||||
|
|
2023 |
|
|
2022 |
|
|
2021 |
|
|||
|
|
(In thousands) |
|
|||||||||
Term Life Insurance segment revenues: |
|
|
|
|
|
|
|
|
|
|||
Other, net |
|
$ |
|
|
$ |
|
|
$ |
|
|||
Total segment revenues from contracts with customers |
|
|
|
|
|
|
|
|
|
|||
Revenues from sources other than contracts with customers |
|
|
|
|
|
|
|
|
|
|||
Total Term Life Insurance segment revenues |
|
$ |
|
|
$ |
|
|
$ |
|
|||
|
|
|
|
|
|
|
|
|
|
|||
Investment and Savings Products segment revenues: |
|
|
|
|
|
|
|
|
|
|||
Commissions and fees: |
|
|
|
|
|
|
|
|
|
|||
Sales-based revenues |
|
$ |
|
|
$ |
|
|
$ |
|
|||
Asset-based revenues |
|
|
|
|
|
|
|
|
|
|||
Account-based revenues |
|
|
|
|
|
|
|
|
|
|||
Other, net |
|
|
|
|
|
|
|
|
|
|||
Total segment revenues from contracts with customers |
|
|
|
|
|
|
|
|
|
|||
Revenues from sources other than contracts |
|
|
|
|
|
|
|
|
|
|||
Total Investment and Savings Products segment revenues |
|
$ |
|
|
$ |
|
|
$ |
|
|||
|
|
|
|
|
|
|
|
|
|
|||
Senior Health segment revenues: |
|
|
|
|
|
|
|
|
|
|||
Commissions and fees |
|
$ |
|
|
$ |
|
|
$ |
|
|||
Other, net |
|
|
|
|
|
|
|
|
|
|||
Total Senior Health segment revenues |
|
$ |
|
|
$ |
|
|
$ |
|
|||
|
|
|
|
|
|
|
|
|
|
|||
Corporate and Other Distributed Products segment revenues: |
|
|
|
|
|
|
|
|
|
|||
Commissions and fees |
|
$ |
|
|
$ |
|
|
$ |
|
|||
Other, net |
|
|
|
|
|
|
|
|
|
|||
Total segment revenues from contracts with customers |
|
|
|
|
|
|
|
|
|
|||
Revenues from sources other than contracts with customers |
|
|
|
|
|
|
|
|
|
|||
Total Corporate and Other Distributed Products segment revenues |
|
$ |
|
|
$ |
|
|
$ |
|
|||
We recognize revenue upon the satisfaction of the related performance obligation, unless the transaction price includes variable consideration that is constrained; in such case, we recognize revenue when the uncertainty associated with the constrained amount is subsequently resolved. Variable consideration is not treated as constrained to the extent it is probable that no significant reversal in the amount of cumulative revenue recognized will occur when the uncertainty associated with the variable consideration is resolved. We have no material obligations for refunds of commission and fees on contracts with customers subsequent to completion of our performance obligation.
Investment and Savings Products Marketing and Distribution Services. We receive commissions and fees from mutual fund companies and annuity providers for the marketing and distribution by the licensed sales representatives of investment and savings products underwritten by such companies and providers. We recognize the sales-based marketing and distribution revenue received from such companies and providers at the point in time our performance obligation to them is satisfied, which is the trade date. The sales-based commissions from mutual fund companies and annuity providers are known and are due at the same time our performance obligation to such mutual fund companies and annuity providers is satisfied. We also receive ongoing asset-based commissions from mutual fund companies and annuity providers each reporting period based on client asset values. We do not recognize revenue for asset-based marketing and distribution commissions until the end of each subsequent reporting period when the amount becomes known and due from mutual fund companies or annuity providers as this revenue represents variable consideration that is fully constrained at the point in time our distinct performance obligation to mutual fund companies and annuity providers is satisfied. We consider variable consideration in the form of asset-based marketing and distribution commissions to be fully constrained as the amounts we will be entitled to collect are highly uncertain and susceptible to factors outside of our control. Such factors include the market values of assets under management and the length of time investors hold their accounts. Asset-based marketing and distribution commissions recognized during the current period are almost exclusively attributable to distinct performance obligations satisfied to mutual fund companies and annuity providers in previous periods.
Investment Advisory and Administrative Services. We provide investment advisory and administrative services over time to investors in the managed investments program we offer. We recognize revenue as our performance obligation is satisfied over time for daily investment advisory and administrative services that are substantially the same and have the same pattern of delivery. Fees for these services, which are based on a percentage of client assets in the managed investments program, become known and are charged to investors during the same reporting period in which the daily investment advisory and administrative services are performed.
118
Shareholder Services. We provide shareholder services over time to investors in the mutual funds in which we serve as the principal distributor in Canada. We recognize revenue as our performance obligation is satisfied over time for shareholder services that are substantially the same and have the same pattern of delivery. Fees for these services, which are based on a percentage of client assets in the mutual funds, become known and are charged to investors during the same reporting period in which the shareholder services are performed.
Account-based Services. We provide distinct transfer agent recordkeeping services for certain mutual funds we distribute and non-bank custodial services to investors purchasing investment products we distribute through qualified retirement accounts in the United States. Fees charged for these account-based services consist primarily of a stated fee for each investment position or each qualified retirement account. Generally, our performance obligation for each account-based service arrangement is satisfied over time and is substantially the same with the same pattern of delivery. We recognize revenue to which we are entitled for each investment position or each qualified account over time based on the time-based pro-rata amount earned each reporting period.
Distribution of Medicare-Related Insurance Products on Behalf of Health Insurance Carriers. As a result of the acquisition of e-TeleQuote, the Company distributes Medicare-related insurance policies to eligible Medicare beneficiaries offered by third-party health insurance carriers. e-TeleQuote receives initial commissions and renewal commissions from health insurance carriers for enrollments in policies it has distributed. The Company recognizes commission revenue in accordance with the following five steps outlined in ASC 606 discussed in further detail below:
The Company’s customers are the health insurance carriers that it contracts with to distribute Medicare-related insurance policies on their behalf.
The Company reviews each contract with customers to determine what promises the Company must deliver and which of these promises are capable of being distinct in the context of the contract. The identification and delivery of new policyholders to the health insurance carriers is the only material promise specified within the contracts. After a policy is approved by the health insurance carrier, the Company has no material additional or recurring obligations to the policyholder or the health insurance carrier. The Company’s performance obligation is complete when a health insurance carrier has received and approved an insurance application. The Company’s contracts do not include downstream policyholder activities such as claims support or payment collection services.
The transaction price is identified as the first-year commission, including administrative and marketing development payments received on a per approved policy basis, due upon the initial approval of a policy as well as an estimate of renewal commission, which we define collectively as the Lifetime value of commissions. Commissions earned are determined based on the health insurance carrier, where the insured is based, and the month in which the policy becomes effective. The commissions are based on contractually agreed upon rate cards for which guidance and ranges are set by the regulatory body – Centers for Medicare and Medicaid Services (“CMS”).
To estimate LTV, the Company utilizes the expected value approach. This approach incorporates historical lapse experience and effective commission rates, an estimate of chargebacks for paid policies that are disenrolled in the first policy year, and forecasted renewal commissions. The estimate of initial and renewal commissions is considered variable consideration and requires significant judgment in determining the number of approved policies that will become disenrolled and the number of periods in which policyholders will remain enrolled. We apply a constraint on our estimate of renewal commissions based on historical experience so that it is probable that a significant reversal in the amount of cumulative revenue will not occur. The uncertainty associated with the variable consideration is subsequently resolved each period the policy remains enrolled or renews.
The Company recognizes the expected Lifetime value of commission revenue by applying the use of a portfolio approach to policies grouped together by the health insurance carrier, Medicare product type, and period the policy was approved by the health insurance carrier (referred to as a “cohort”). This approach to estimating the commissions expected to be collected for each cohort involves the evaluation of various factors, including but not limited to, contracted commission rates, disenrollment experience and renewal persistency rates.
We recognize revenue for approved applications during the period by applying the latest estimated constrained LTV. We recognize adjustments to revenue for approved applications in prior periods when our cash collections are, or are expected to be, different from the estimated constrained LTVs, which we refer to as tail adjustments. Tail adjustments to revenue occur when actual cash collections or communicated rate increases have indicated a trend that is different from the estimated constrained LTV. Tail adjustments to
119
revenue can be positive or negative and we recognize positive adjustments to revenue when we do not believe it is probable that a significant reversal of cumulative revenue will occur.
Other Senior Health Segment Revenues. As a result of the acquisition of e-TeleQuote, the Company earns revenues for providing certain marketing services and health risk assessment services to health insurance carriers during the process of selling Medicare-related insurance products on behalf of health insurance carriers, which are recorded in Other, net revenue.
Distribution of Other Third-party Financial Products. We distribute various other financial products on behalf of third parties to consumers. We receive up-front commissions and/or renewal commissions from product providers for sales of other financial product sales we have arranged. We recognize revenue at the point in time our performance obligation to product providers is satisfied, which is generally on the date the financial product is purchased by the consumer from the product provider. For certain financial products, most notably prepaid legal subscriptions and auto and homeowners’ insurance referrals, we receive ongoing renewal commissions that coincide with recurring payments received by product providers from active subscribers or policyholders. Ongoing renewal commissions represent variable consideration that will not be resolved until after the reporting period in which our performance obligation has been satisfied. We estimate variable consideration in the transaction price for these financial products (with the exception of miscellaneous products for which we expect nominal ongoing commissions) as the expected amount of commissions to be received over the life of the subscription or referred policy and apply a constraint so that it is probable that a subsequent change in estimate will not result in a significant revenue reversal. Management judgment primarily is required to determine the average life of a subscription or referred policy, which we establish based on historical information. We recognize variable consideration in excess of the amount constrained in subsequent reporting periods when the uncertainty is resolved and the excess amounts are due from the product providers.
Revenue for Other Services. We recognize revenue from the sale of other miscellaneous products and services, including monthly subscription fees from the sales representatives for access to POL, upon the transfer of the promised product or service. For POL subscriptions, we satisfy our performance obligation by providing subscribers access to the promised services over time during each monthly subscription period. Revenue recognized from the sale of other miscellaneous products and services becomes known and charged at the same time we satisfy the corresponding performance obligation.
Renewal Commissions Receivable. For revenue associated with ongoing renewal commissions in the Senior Health and Corporate and Other Distributed Products segments, we record a renewal commission receivable asset for the amount of ongoing renewal commissions we anticipate collecting in reporting periods subsequent to the satisfaction of the performance obligation, less amounts that are constrained in the accompanying consolidated balance sheets.
Activity in the Renewal commissions receivable account was as follows:
|
|
December 31, 2023 |
|
|
December 31, 2022 |
|
|
December 31, 2021 |
|
|||
|
|
(In thousands) |
|
|||||||||
Senior Health segment: |
|
|
|
|
|
|
|
|
|
|||
Balance, beginning of period |
|
$ |
|
|
$ |
|
|
$ |
- |
|
||
Contract balances acquired as part of business combination |
|
|
- |
|
|
|
- |
|
|
|
|
|
Measurement period adjustment |
|
|
- |
|
|
|
( |
) |
|
|
( |
) |
Commissions revenue |
|
|
|
|
|
|
|
|
|
|||
Less: collections |
|
|
( |
) |
|
|
( |
) |
|
|
( |
) |
Tail revenue adjustment from change in estimate |
|
|
|
|
|
( |
) |
|
|
( |
) |
|
Balance, at the end of period |
|
$ |
|
|
$ |
|
|
$ |
|
|||
|
|
|
|
|
|
|
|
|
|
|||
Corporate and Other Distributed Products segment: |
|
|
|
|
|
|
|
|
|
|||
Balance, beginning of period |
|
$ |
|
|
$ |
|
|
$ |
|
|||
Commissions revenue |
|
|
|
|
|
|
|
|
|
|||
Less: collections |
|
|
( |
) |
|
|
( |
) |
|
|
( |
) |
Balance, at the end of period |
|
$ |
|
|
$ |
|
|
$ |
|
|||
Incremental costs to obtain or fulfill contracts, most notably sales commissions to the sales representatives, are not incurred prior to the recognition of the related revenue. Therefore, we have
(20) Leases
We have operating leases for office space and other real estate and finance leases of office equipment. During 2023, we extended the lease for our home office facility located in Duluth, Georgia.
120
In aggregate, our leases have remaining lease terms of less than
The components of lease expense were as follows:
|
|
Year ended December 31, |
|
|||||||||
|
|
2023 |
|
|
2022 |
|
|
2021 |
|
|||
|
|
(In thousands) |
|
|||||||||
Operating lease cost |
|
|
|
|
|
|
|
|
|
|||
Operating lease cost |
|
$ |
|
|
$ |
|
|
$ |
|
|||
Variable lease cost (includes taxes, common area maintenance and insurance) |
|
|
|
|
|
|
|
|
|
|||
Finance lease cost |
|
|
|
|
|
|
|
|
|
|||
Depreciation of finance lease assets |
|
|
|
|
|
|
|
|
|
|||
Interest on lease liabilities |
|
|
|
|
|
|
|
|
|
|||
Total lease cost |
|
$ |
|
|
$ |
|
|
$ |
|
|||
Other information related to leases was as follows:
|
|
Year ended December 31, |
|
|||||||||
|
|
2023 |
|
|
2022 |
|
|
2021 |
|
|||
|
|
(In thousands) |
|
|||||||||
Supplemental Cash Flows Information |
|
|
|
|
|
|
|
|
|
|||
Cash paid for amounts included in the measurement of lease liabilities: |
|
|
|
|
|
|
|
|
|
|||
Operating cash flows used in operating leases (1) |
|
$ |
|
|
$ |
|
|
$ |
|
|||
Operating cash flows used in finance leases (1) |
|
|
|
|
|
|
|
|
|
|||
Financing cash flows used in finance leases |
|
|
|
|
|
|
|
|
|
|||
|
|
December 31, 2023 |
|
|
December 31, 2022 |
|
||
|
|
|
|
|||||
Weighted Average Remaining Lease Term |
|
|
|
|
|
|
||
Operating leases |
|
|
|
|
||||
Finance leases |
|
|
|
|
||||
|
|
|
|
|
|
|
||
Weighted Average Discount Rate |
|
|
|
|
|
|
||
Operating leases |
|
|
% |
|
|
% |
||
Finance leases |
|
|
% |
|
|
% |
||
Future minimum lease payments under non-cancellable leases were as follows:
|
|
Operating Leases |
|
|
Finance Leases |
|
||
Year Ended December 31, |
|
(In thousands) |
|
|||||
2024(1) |
|
$ |
|
|
$ |
|
||
2025 |
|
|
|
|
|
|
||
2026 |
|
|
|
|
|
|
||
2027 |
|
|
|
|
|
- |
|
|
2028 |
|
|
|
|
|
- |
|
|
Thereafter |
|
|
|
|
|
- |
|
|
Total minimum rental commitments for operating leases |
|
|
|
|
|
|
||
Less imputed interest |
|
|
|
|
|
|
||
Total lease liabilities |
|
$ |
|
|
$ |
|
||
(21) Acquisition
On
The Company’s subsidiary, Primerica Health, purchased from the shareholders of Etelequote Limited (“Etelequote Bermuda”)
121
cash, (ii) replacement of e-TeleQuote’s debt as of the closing date of $
In connection with the Company’s acquisition of 80% of e-TeleQuote on July 1, 2021 (the “Acquisition Date”), the Company entered into a Shareholders’ Agreement with the noncontrolling equity holders of Primerica Health. Under the terms of the Shareholders’ Agreement, the Company agreed to purchase, and the noncontrolling equity holders agreed to sell, the remaining
The following table presents the preliminary purchase price allocation recorded in the Company’s consolidated balance sheets as of the Acquisition Date, adjustments made during the measurement period that ended June 30, 2022, and the final purchase price allocation:
|
|
Preliminary Purchase Price Allocation |
|
|
2021 Measurement Period Adjustments |
|
|
2022 Measurement Period Adjustments |
|
|
Revised Preliminary Purchase Price Allocation |
|
||||
|
|
(In thousands) |
|
|||||||||||||
Assets: |
|
|
|
|
|
|
|
|
|
|
|
|
||||
Cash and cash equivalent |
|
$ |
|
|
$ |
- |
|
|
$ |
- |
|
|
$ |
|
||
Accounts receivables |
|
|
|
|
|
( |
) |
|
|
- |
|
|
|
|
||
Renewal commissions receivable |
|
|
|
|
|
( |
) |
|
|
( |
) |
|
|
|
||
Other assets |
|
|
|
|
|
- |
|
|
|
- |
|
|
|
|
||
Intangible assets |
|
|
|
|
|
( |
) |
|
|
- |
|
|
|
|
||
Goodwill |
|
|
|
|
|
|
|
|
|
|
|
|
||||
Total assets |
|
$ |
|
|
$ |
( |
) |
|
$ |
( |
) |
|
$ |
|
||
|
|
|
|
|
|
|
|
|
|
|
|
|
||||
Liabilities: |
|
|
|
|
|
|
|
|
|
|
|
|
||||
Accounts payable and accrued expenses |
|
|
|
|
|
( |
) |
(1) |
|
- |
|
|
|
|
||
Deferred tax liability |
|
|
|
|
|
( |
) |
|
|
( |
) |
|
|
|
||
Other liabilities |
|
|
|
|
|
- |
|
|
|
- |
|
|
|
|
||
Total liabilities |
|
|
|
|
|
( |
) |
|
|
( |
) |
|
|
|
||
Net assets acquired |
|
$ |
|
|
$ |
( |
) |
|
$ |
- |
|
|
$ |
|
||
|
|
|
|
|
|
|
|
|
|
|
|
|
||||
Temporary Stockholders' Equity: |
|
|
|
|
|
|
|
|
|
|
|
|
||||
Redeemable noncontrolling interests |
|
$ |
|
|
$ |
- |
|
|
$ |
- |
|
|
$ |
|
||
Total temporary stockholders' equity |
|
$ |
|
|
$ |
- |
|
|
$ |
- |
|
|
$ |
|
||
Renewal commissions receivable from the acquired business was recognized in accordance with Accounting Standards Codification Topic 606, Revenue from Contracts with Customers (“ASC 606”) as the Company adopted Accounting Standards Update No. 2021-08, Business Combinations (Topic 805): Accounting for Contract Assets and Contract Liabilities from Contracts with Customers (“ASU 2021-08”). ASU 2021-08 requires contract assets arising from revenue contracts with customers to be accounted for in
accordance with ASC 606 instead of at fair value.
During the measurement period, the Company made two adjustments to renewal commissions receivable as of the Acquisition Date. The adjustments, which were booked in 2021 and 2022, resulted from the Company’s reassessment of the estimates made by e-TeleQuote for the variable consideration expected for approved policies as of the Acquisition Date. The reassessment of estimates involved the implementation of an enhanced algorithmic model for processing historical lapse data and forecasting future policy duration curves. In addition, the Company revised the estimate for renewal commission rate escalation assumptions in accordance
122
with its accounting policy for determining constraints of variable consideration. As a result, the Company recognized a purchase price allocation adjustment to decrease renewal commissions receivable and deferred tax liability with a corresponding increase to goodwill.
Intangible assets identified in the acquisition of the business are capitalized separately from goodwill if the fair value can be measured reliably on initial recognition (transaction date). The primary intangible assets identified were customer relationships with health insurance carriers of $
Goodwill is calculated as the difference between the acquisition date fair value of the total consideration transferred and the aggregate values assigned to the assets acquired and liabilities assumed. The amount of goodwill calculated as of the Acquisition Date determined by the final purchase price allocation was $
Transaction costs related to the e-TeleQuote acquisition included within Other operating expenses on the consolidated statements of income was $(
The following unaudited pro forma consolidated financial information combines the audited results of the Company for the year ended December 31, 2021 and the unaudited results of e-TeleQuote for the year ended December 31, 2021, and assumes that the Acquisition, which closed on July 1, 2021, was completed on January 1, 2021 (the first day of fiscal year 2021). The pro forma consolidated financial information has been calculated after applying adjustments for amortization expense of acquired intangible assets and the consequential tax effect. These pro forma results have been prepared for comparative purpose only and do not purport to be indicative of the operating results of the Company that would have been achieved had the e-TeleQuote acquisition actually taken place on January 1, 2021.
|
|
Year ended December 31, 2021 |
|
|
|
|
(in thousands) |
|
|
Revenue |
|
$ |
|
|
Net income (loss) |
|
|
|
|
(22) Goodwill
The rollforward of goodwill recognized by the Company in its Senior Health reporting unit was as follows:
|
|
Gross Goodwill |
|
|
Accumulated Impairment Loss |
|
|
Net Goodwill |
|
|||
|
|
(In thousands) |
|
|||||||||
Balance as of December 31, 2020 |
|
$ |
- |
|
|
$ |
- |
|
|
$ |
- |
|
Goodwill acquired |
|
|
|
|
|
- |
|
|
|
|
||
Impairment recognized |
|
|
- |
|
|
|
( |
) |
|
|
( |
) |
Balance as of December 31, 2021 |
|
$ |
|
|
$ |
( |
) |
|
$ |
|
||
Measurement period adjustment |
|
|
|
|
|
- |
|
|
|
|
||
Impairment recognized |
|
|
- |
|
|
|
( |
) |
|
|
( |
) |
Balance as of December 31, 2022 |
|
$ |
|
|
$ |
( |
) |
|
$ |
|
||
Impairment recognized |
|
|
- |
|
|
|
- |
|
|
|
- |
|
Balance as of December 31, 2023 |
|
$ |
|
|
$ |
( |
) |
|
$ |
|
||
As of December 31, 2021, we identified events and circumstances that suggested it was more likely than not that the fair value of the Senior Health reporting unit was not greater than its carrying value. These events and circumstances consisted of various factors, including recent financial performance, elevated industry-wide policy churn, and declines in the market value of publicly traded peers. As a result, the Company performed a quantitative impairment analysis using a combination of the income and market approaches. We utilized an income approach by preparing a discounted cash flow analysis to determine the reporting unit’s fair value. The discounted cash flow analysis included key assumptions such as the weighted average cost of capital (“WACC”), long-term growth rate and projected operating results such as approved policies, LTV’s, contract acquisition costs, operating expenses, collections of renewal commissions receivable, and utilization of net operating losses for income tax purposes. We utilized a market approach by deriving the reporting unit’s fair value applying publicly-traded peer company trading multiples to forward looking operating results. We then weighted each approach to determine the reporting unit’s fair value placing greater emphasis on the income approach as we believe management’s expectations of the cash flow generated by the reporting unit were more relevant in determining fair value given the limitations in the creditability of available peer company data. The measurement of the reporting unit’s fair value as of
123
December 31, 2021 was classified as a level 3 fair value measurement given significance of the unobservable inputs such as forecasted operating results, discount rates, normalized peer company operating information and weights assigned to each approach that are used in determining the fair value. After the fair value of the reporting unit was determined, the Company calculated its carrying value by taking the reporting unit’s assets minus its liabilities. The carrying value of the reporting unit was then compared to its fair value to determine the goodwill impairment recognized as of December 31, 2021.
During the annual impairment test as of July 1, 2022, the Company performed a quantitative impairment analysis using the income approach by preparing a discounted cash flow analysis to determine the reporting unit’s fair value. The discounted cash flow analysis included key assumptions such as the WACC, long-term growth rate and projected operating results such as approved policies, lifetime value of commissions, contract acquisition costs, operating expenses, collections of renewal commissions receivable, and utilization of net operating losses for income tax purposes. We did not utilize a market approach as part of the quantitative impairment analysis as of July 1, 2022 as we identified a lack of credibility in the available peer company data at that time and believed management’s expectations of the cash flow generated by the reporting unit were more relevant in determining the fair value. The measurement of the reporting unit’s fair value as of July 1, 2022 was classified as a Level 3 fair value measurement given the significance of the unobservable inputs such as forecasted operating results and discount rates.
After the fair value of the reporting unit was determined, the Company calculated its carrying value by taking the reporting unit’s assets minus its liabilities. The carrying value of the reporting unit was then compared to its fair value to determine the goodwill impairment recognized as of July 1, 2022. The decline of the Senior Health reporting unit’s fair value below its carrying value as of July 1, 2022 that led to the impairment recognized in 2022 was primarily driven by an increase in the market-based WACC used to discount the forecasted cash flows at that time. The increase in the WACC as of July 1, 2022 was driven by increases in the equity market risk premium and higher interest rates.
During the annual impairment test as of July 1, 2023, the Company performed a quantitative impairment analysis using the income approach by preparing a discounted cash flow analysis to determine the reporting unit’s fair value. The discounted cash flow analysis included key assumptions such as the WACC, long-term growth rate and projected operating results such as approved policies, lifetime value of commissions, contract acquisition costs, operating expenses, collections of renewal commissions receivable, and utilization of net operating losses for income tax purposes. Similar to 2022, we did not utilize a market approach as part of the quantitative impairment analysis as of July 1, 2023 as we identified a lack of credibility in the available peer company data at that time and management’s assessment that its expectations of the cash flow generated by the reporting unit were more relevant in determining the fair value. The measurement of the reporting unit’s fair value as of July 1, 2023 was classified as a Level 3 fair value measurement given the significance of the unobservable inputs such as forecasted operating results and discount rates. After the fair value of the reporting unit was determined, the Company calculated its carrying value by taking the reporting unit’s assets minus its liabilities. The carrying value of the reporting unit was then compared to its fair value and no impairment was determined as its fair value exceeded its carrying value as of July 1, 2023.
The goodwill impairment charges recognized in 2022 and 2021 did not impact the Company’s income tax expense as the goodwill acquired from the e-TeleQuote acquisition does not have any tax basis. The determination of whether the carrying value of the reporting unit exceeds its fair value involves a high degree of estimation and can be affected by a number of industry and company-specific risk factors that are subject to change over time.
124
ITEM 9. CHANGES IN AND DISAGREEMENTS WITH ACCOUNTANTS ON ACCOUNTING AND FINANCIAL DISCLOSURE.
There have been no changes in, or disagreements with, accountants on accounting and financial disclosure matters during the years ended December 31, 2023 and 2022.
ITEM 9A. CONTROLS AND PROCEDURES.
Disclosure Controls and Procedures
The Company’s management, with the participation of the Company’s Chief Executive Officer and Chief Financial Officer, has evaluated the effectiveness of the Company’s disclosure controls and procedures (as such term is defined in Rules 13a-15(e) and 15d-15(e) under the Securities Exchange Act of 1934, as amended (the “Exchange Act”)) as of the end of the period covered by this report (the “Evaluation Date”). Based on such evaluation, the Company’s Chief Executive Officer and Chief Financial Officer have concluded that, as of the Evaluation Date, the Company’s disclosure controls and procedures are effective.
Changes in Internal Control Over Financial Reporting
There have not been any changes in the Company’s internal control over financial reporting (as such term is defined in Rules 13a-15(f) and 15d-15(f) under the Exchange Act) during the fourth quarter of 2023 that have materially affected, or are reasonably likely to materially affect, the Company’s internal control over financial reporting.
Management’s Annual Report On Internal Control Over Financial Reporting
Our management is responsible for establishing and maintaining adequate internal control over financial reporting for the Company. With the participation of the Chief Executive Officer and the Chief Financial Officer, our management conducted an evaluation of the effectiveness of our internal control over financial reporting based on the framework and criteria established in Internal Control—Integrated Framework (2013), issued by the Committee of Sponsoring Organizations of the Treadway Commission. Based on this evaluation, our management has concluded that our internal control over financial reporting was effective as of December 31, 2023.
Our independent auditor, KPMG LLP, an independent registered public accounting firm, has issued an attestation report on the effectiveness of our internal control over financial reporting. This attestation report appears below.
125
Report of Independent Registered Public Accounting Firm
To the Stockholders and Board of Directors
Primerica, Inc.:
Opinion on Internal Control Over Financial Reporting
We have audited Primerica, Inc. and subsidiaries’ (the Company) internal control over financial reporting as of December 31, 2023, based on criteria established in Internal Control – Integrated Framework (2013) issued by the Committee of Sponsoring Organizations of the Treadway Commission. In our opinion, the Company maintained, in all material respects, effective internal control over financial reporting as of December 31, 2023, based on criteria established in Internal Control – Integrated Framework (2013) issued by the Committee of Sponsoring Organizations of the Treadway Commission.
We also have audited, in accordance with the standards of the Public Company Accounting Oversight Board (United States) (PCAOB), the consolidated balance sheets of the Company as of December 31, 2023 and 2022, the related consolidated statements of income, comprehensive income, stockholders’ equity, and cash flows for each of the years in the three-year period ended December 31, 2023, and the related notes and financial statement schedules I, II, III and IV (collectively, the consolidated financial statements), and our report dated February 28, 2024 expressed an unqualified opinion on those consolidated financial statements.
Basis for Opinion
The Company’s management is responsible for maintaining effective internal control over financial reporting and for its assessment of the effectiveness of internal control over financial reporting, included in the accompanying Management’s Annual Report on Internal Control Over Financial Reporting. Our responsibility is to express an opinion on the Company’s internal control over financial reporting based on our audit. We are a public accounting firm registered with the PCAOB and are required to be independent with respect to the Company in accordance with the U.S. federal securities laws and the applicable rules and regulations of the Securities and Exchange Commission and the PCAOB.
We conducted our audit in accordance with the standards of the PCAOB. Those standards require that we plan and perform the audit to obtain reasonable assurance about whether effective internal control over financial reporting was maintained in all material respects. Our audit of internal control over financial reporting included obtaining an understanding of internal control over financial reporting, assessing the risk that a material weakness exists, and testing and evaluating the design and operating effectiveness of internal control based on the assessed risk. Our audit also included performing such other procedures as we considered necessary in the circumstances. We believe that our audit provides a reasonable basis for our opinion.
Definition and Limitations of Internal Control Over Financial Reporting
A company’s internal control over financial reporting is a process designed to provide reasonable assurance regarding the reliability of financial reporting and the preparation of financial statements for external purposes in accordance with generally accepted accounting principles. A company’s internal control over financial reporting includes those policies and procedures that (1) pertain to the maintenance of records that, in reasonable detail, accurately and fairly reflect the transactions and dispositions of the assets of the company; (2) provide reasonable assurance that transactions are recorded as necessary to permit preparation of financial statements in accordance with generally accepted accounting principles, and that receipts and expenditures of the company are being made only in accordance with authorizations of management and directors of the company; and (3) provide reasonable assurance regarding prevention or timely detection of unauthorized acquisition, use, or disposition of the company’s assets that could have a material effect on the financial statements.
Because of its inherent limitations, internal control over financial reporting may not prevent or detect misstatements. Also, projections of any evaluation of effectiveness to future periods are subject to the risk that controls may become inadequate because of changes in conditions, or that the degree of compliance with the policies or procedures may deteriorate.
/s/ KPMG LLP
Atlanta, Georgia
February 28, 2024
126
ITEM 9B. OTHER INFORMATION.
Trading Plans
During the quarter ended December 31, 2023,
ITEM 9C. DISCLOSURE REGARDING FOREIGN JURISDICTIONS THAT PREVENT INSPECTIONS.
Not applicable.
127
PART III
Pursuant to General Instruction G to Form 10-K and as described below, portions of Items 10 through 14 of this report are incorporated by reference from the Company’s definitive Proxy Statement relating to the Company’s 2024 Annual Meeting of Stockholders to be held on May 8, 2024 (the “Proxy Statement”), which will be filed with the SEC within 120 days of December 31, 2023, pursuant to Regulation 14A under the Exchange Act. The Report of the Audit Committee of our Board of Directors and the Report of the Compensation Committee of our Board of Directors to be included in the Proxy Statement shall be deemed to be furnished in this report and shall not be incorporated by reference into any filing under the Securities Act of 1933, as amended, as a result of such furnishing.
Our website address is www.primerica.com. You may obtain free electronic copies of our annual reports on Form 10-K, quarterly reports on Form 10-Q, current reports on Form 8-K, and all amendments to those reports from the investors section of our website. These reports are available on our website as soon as reasonably practicable after we electronically file them with the SEC. These reports should also be available through the SEC’s website at www.sec.gov.
We have adopted Corporate Governance Guidelines. The Corporate Governance Guidelines and the charters of our Board committees are available in the corporate governance subsection of the investor relations section of our website, www.primerica.com, and are also available in print upon written request to the Corporate Secretary, Primerica, Inc., 1 Primerica Parkway, Duluth, GA 30099.
Item 10. Directors, Executive Officers and Corporate Governance.
For a list of executive officers, see “Part I, Item X. Information About Our Executive Officers and Certain Significant Employees”, included elsewhere in this report.
We have adopted a written Code of Conduct that applies to directors, officers and employees, including a separate code that applies to only our principal executive officers and senior financial officers in accordance with Section 406 of the Sarbanes-Oxley Act of 2002 and the rules of the SEC promulgated thereunder. Our Code of Conduct is available in the corporate governance subsection of the investor relations section of our website, www.primerica.com, and is available in print upon written request to the Corporate Secretary, Primerica, Inc., 1 Primerica Parkway, Duluth, GA 30099. In the event that we make changes in, or provide waivers from, the provisions of the Code of Conduct that the SEC requires us to disclose, we will disclose these events in the corporate governance section of our website.
Except for the information above and the information set forth in “Part I, Item X. Information About Our Executive Officers and Certain Significant Employees”, the information required by this item will be contained under the following headings in the Proxy Statement and is incorporated herein by reference:
Item 11. Executive Compensation.
The information required by this item will be contained under the following headings in the Proxy Statement and is incorporated herein by reference:
Item 12. Security Ownership of Certain Beneficial Owners and Management and Related Stockholder Matters.
Securities Authorized for Issuance Under Equity Compensation Plans
We have two compensation plans under which our equity securities are authorized for issuance. The Primerica, Inc. 2020 Omnibus Incentive Plan was approved by our stockholders in May 2020. The Primerica, Inc. Stock Purchase Plan for Agents and Employees
128
was approved by our sole stockholder in March 2010. The following table sets forth certain information relating to these equity compensation plans at December 31, 2023.
|
Number of securities |
|
|
|
Weighted average |
|
|
|
Number of securities |
|
|
|||
Equity compensation plans approved by stockholders: |
|
|
|
|
|
|
|
|
|
|
|
|||
Primerica, Inc. Second Amended and Restated 2020 Omnibus |
|
237,095 |
|
(1) |
|
$ |
- |
|
(2) |
|
|
1,252,002 |
|
(3) |
Primerica, Inc. Stock Purchase Plan for Agents and Employees |
|
- |
|
|
|
|
- |
|
|
|
|
1,646,243 |
|
(4) |
Total |
|
237,095 |
|
|
|
$ |
- |
|
|
|
|
2,898,245 |
|
|
Equity compensation plans not approved by stockholders |
n/a |
|
|
|
n/a |
|
|
|
n/a |
|
|
|||
Other information required by this item will be contained under the following headings in the Proxy Statement and is incorporated
herein by reference:
Item 13. Certain Relationships and Related Transactions, and Director Independence.
The information required by this item will be contained under the following headings in the Proxy Statement and is incorporated herein by reference:
Item 14. Principal Accountant Fees and Services.
The information required by this item will be contained under the following headings in the Proxy Statement and is incorporated herein by reference:
129
PART IV
ITEM 15. EXHIBITS, FINANCIAL STATEMENT SCHEDULES.
(a) 1. FINANCIAL STATEMENTS
Included in Part II, Item 8, of this report:
Primerica, Inc.:
Report of Independent Registered Public Accounting Firm ( |
|
77 |
Consolidated Balance Sheets as of December 31, 2023 and 2022 |
|
79 |
|
80 |
|
|
81 |
|
|
82 |
|
|
83 |
|
|
84 |
2. FINANCIAL STATEMENT SCHEDULES
Included in Part IV of this report:
|
135 |
|
|
136 |
|
|
142 |
|
Schedule IV — Reinsurance for each of the years in the three-year period ended December 31, 2023 |
|
143 |
3. EXHIBIT INDEX –
An “Exhibit Index” has been filed as part of this report beginning on the following page and is incorporated herein by reference.
Schedules other than those listed above are omitted because they are not required, are not material, are not applicable, or the required information is shown in the financial statements or notes thereto.
(b) Exhibit Index.
The agreements included as exhibits to this report are included to provide information regarding the terms of these agreements and are not intended to provide any other factual or disclosure information about the Company or its subsidiaries, our business or the other parties to these agreements. These agreements may contain representations and warranties by each of the parties to the applicable agreement. These representations and warranties have been made solely for the benefit of the other parties to the applicable agreement and:
Accordingly, these representations and warranties may not describe the actual state of affairs as of the date they were made or at any other time, and should not be relied upon by investors.
Exhibit Number |
|
Description |
|
Reference |
2.1 |
|
|
Incorporated by reference to Exhibit 2.1 to Primerica’s Current Report on Form 8-K filed April 19, 2021 (Commission File No. 001-34680). |
130
2.2 |
|
|
Incorporated by reference to Exhibit 2.2 to Primerica’s Current Report on Form 8-K filed July 1, 2021 (Commission File No. 001-34680) |
|
3.1 |
|
Amended and Restated Certificate of Incorporation of the Registrant. |
|
Incorporated by reference to Exhibit 3.1 to Primerica's Current Report on Form 8-K filed May 24, 2013 (Commission File No. 001-34680). |
3.2 |
|
|
Incorporated by reference to Exhibit 3.1 to Primerica’s Current Report on Form 8-K filed March 3, 2023 (Commission File No. 001-34680). |
|
4.1 |
|
|
Incorporated by reference to Exhibit 4.1 to Primerica's Current Report on Form 8-K filed July 16, 2012 (Commission File No. 001-34680). |
|
4.2 |
|
|
Incorporated by reference to Exhibit 4.2 to Primerica’s Current Report on Form 8-K filed November 19, 2021 (Commission File No. 001-34680). |
|
4.3 |
|
|
Incorporated by reference to Exhibit 4.2 to Primerica’s Current Report on Form 8-K filed November 19, 2021 (Commission File No. 001-34680). |
|
4.4 |
|
|
Incorporated by reference to Exhibit 4.3 to Primerica’s Current Report on Form 8-K filed November 19, 2021 (Commission File No. 001-34680). |
|
4.5 |
|
|
Incorporated by reference to Exhibit 4.4 to Primerica’s Current Report on Form 8-K filed November 19, 2021 (Commission File No. 001-34680). |
|
4.6 |
|
|
Incorporated by reference to Exhibit 4.4 to Primerica’s Annual Report on Form 10-K for the year ended December 31, 2020 filed March 1, 2021 (Commission File No. 001-34680). |
|
10.1 |
|
|
Incorporated by reference to Exhibit 10.1 to Primerica’s Current Report on Form 8-K filed June 24, 2021 (Commission File No. 001-34680). |
|
10.2 |
|
Tax Separation Agreement dated as of March 30, 2010 by and between the Registrant and Citigroup Inc. |
|
Incorporated by reference to Exhibit 10.3 to Primerica's Quarterly Report on Form 10-Q for the quarter ended March 31, 2010 (Commission File No. 001- 34680). |
10.3 |
|
|
Incorporated by reference to Exhibit 10.6 to Primerica's Quarterly Report on Form 10-Q for the quarter ended March 31, 2010 (Commission File No. 001-34680). |
|
10.4 |
|
|
Incorporated by reference to Exhibit 10.29 to Primerica's Quarterly Report on Form 10-Q for the quarter ended September 30, 2015 (Commission File No. 001-34680). |
|
10.5 |
|
|
Incorporated by reference to Exhibit 10.1 to Primerica's Quarterly Report on Form 10-Q for the quarter ended March 31, 2016 (Commission File No. 001-34680). |
|
10.6 |
|
|
Incorporated by reference to Exhibit 10.2 to Primerica's Quarterly Report on Form 10-Q for the quarter ended March 31, 2016 (Commission File No. 001-34680). |
|
10.7 |
|
|
Incorporated by reference to Exhibit 10.1 to Primerica’s Quarterly Report on Form 10-Q for the quarter ended June 30, 2022 (Commission File No. 001-34680). |
|
10.8 |
|
|
Incorporated by reference to Exhibit 10.2 to Primerica’s Quarterly Report on Form 10-Q for the quarter ended June 30, 2022 (Commission File No. 001-34680). |
131
10.9 |
|
|
Incorporated by reference to Exhibit 10.3 to Primerica’s Quarterly Report on Form 10-Q for the quarter ended June 30, 2022 (Commission File No. 001-34680). |
|
10.10 |
|
|
Incorporated by reference to Exhibit 10.8 to Primerica's Quarterly Report on Form 10-Q for the quarter ended March 31, 2010 (Commission File No. 001-34680). |
|
10.11 |
|
|
Incorporated by reference to Exhibit 10.5 to Primerica's Quarterly Report on Form 10-Q for the quarter ended March 31, 2016 (Commission File No. 001-34680). |
|
10.12 |
|
|
Incorporated by reference to Exhibit 10.9 to Primerica's Quarterly Report on Form 10-Q for the quarter ended March 31, 2010 (Commission File No. 001-34680). |
|
10.13 |
|
|
Incorporated by reference to Exhibit 10.6 to Primerica's Quarterly Report on Form 10-Q for the quarter ended March 31, 2016 (Commission File No. 001-34680). |
|
10.14 |
|
|
Incorporated by reference to Exhibit 10.7 to Primerica's Quarterly Report on Form 10-Q for the quarter ended March 31, 2016 (Commission File No. 001-34680). |
|
10.15 |
|
|
Incorporated by reference to Exhibit 10.11 to Primerica's Quarterly Report on Form 10-Q for the quarter ended March 31, 2010 (Commission File No. 001-34680). |
|
10.16 |
|
|
Incorporated by reference to Exhibit 10.15 to Primerica’s Annual Report on Form 10-K for the year ended December 31, 2020 (Commission File No. 001-34680). |
|
10.17 |
|
|
Incorporated by reference to Exhibit 10.13 to Primerica's Quarterly Report on Form 10-Q for the quarter ended March 31, 2010 (Commission File No. 001-34680). |
|
10.18 |
|
|
Incorporated by reference to Exhibit 10.19 to Primerica's Annual Report on Form 10-K for the year ended December 31, 2016 (Commission File No. 001-34680). |
|
10.19 |
|
|
Incorporated by reference to Exhibit 10.20 to Primerica's Annual Report on Form 10-K for the year ended December 31, 2016 (Commission File No. 001-34680). |
|
10.20 |
|
|
Incorporated by reference to Exhibit 10.19 to Primerica’s Annual Report on Form 10-K for the year ended December 31, 2019 (Commission File No. 001-34680). |
|
10.21 |
|
|
Incorporated by reference to Exhibit 10.20 to Primerica’s Annual Report on Form 10-K for the year ended December 31, 2019 (Commission File No. 001-34680). |
|
10.22 |
|
|
Incorporated by reference to Exhibit 10.21 to Primerica's Annual Report on Form 10-K for the year ended December 31, 2016 (Commission File No. 001-34680). |
|
10.23* |
|
Primerica, Inc. Stock Purchase Plan for Agents and Employees. |
|
Incorporated by reference to Exhibit 10.45 to Primerica's Quarterly Report on Form 10-Q for the quarter ended March 31, 2010 (Commission File No. 001-34680). |
132
10.24* |
|
|
Incorporated by reference to Exhibit 10.1 to Primerica’s Registration Statement on Form S-8 filed (Commission File No. 333-238268) |
|
10.25* |
|
|
Incorporated by reference to Exhibit 10.26 to Primerica’s Annual Report on Form 10-K for the year ended December 31, 2021 filed March 1, 2022 (Commission File No. 001-34680). |
|
10.26* |
|
|
Incorporated by reference to Exhibit 10.27 to Primerica’s Annual Report on Form 10-K for the year ended December 31, 2022 filed on February 28, 2023 (Commission File No. 333-238268). |
|
10.27* |
|
|
Filed with the Securities and Exchange Commission as part of this Annual Report. |
|
10.28* |
|
|
Incorporated by reference to Exhibit 10.29 to Primerica’s Annual Report on Form 10-K for the year ended December 31, 2021 (Commission File No. 001-34680). |
|
10.29* |
|
|
Incorporated by reference to Exhibit 10.30 to Primerica’s Annual Report on Form 10-K for the year ended December 31, 2022 filed on February 28, 2023 (Commission File No. 333-238268) |
|
10.30* |
|
|
Filed with the Securities and Exchange Commission as part of this Annual Report. |
|
10.31* |
|
|
Incorporated by reference to Exhibit 10.2 to Primerica’s Current Report on Form 8-K filed on September 14, 2023 (Commission File No. 001-34680). |
|
10.32* |
|
|
Filed with the Securities and Exchange Commission as part of this Annual Report. |
|
10.33* |
|
Form of Indemnification Agreement for Directors and Officers. |
|
Incorporated by reference to Exhibit 10.48 to Primerica's Registration Statement on Form S-1 (File No. 333-162918). |
10.34 |
|
|
Incorporated by reference to Exhibit 99.4 to Primerica's Current Report on Form 8-K filed January 5, 2015 (Commission File No. 001-34680). |
|
10.35* |
|
|
Incorporated by reference to Exhibit 99.5 to Primerica's Current Report on Form 8-K filed January 5, 2015 (Commission File No. 001-34680). |
|
10.36* |
|
|
Incorporated by reference to Exhibit 10.30 to Primerica's Annual Report on Form 10-K for the year ended December 31, 2015 (Commission File No. 001-34680). |
|
10.37* |
|
|
Incorporated by reference to Exhibit 99.6 to Primerica's Current Report on Form 8-K filed January 5, 2015 (Commission File No. 001-34680). |
|
10.38* |
|
|
Incorporated by reference to Exhibit 10.32 to Primerica's Annual Report on Form 10-K for the year ended December 31, 2015 (Commission File No. 001-34680). |
|
10.39* |
|
|
Incorporated by reference to Exhibit 99.7 to Primerica's Current Report on Form 8-K filed January 5, 2015 (Commission File No. 001-34680). |
|
10.40* |
|
|
Incorporated by reference to Exhibit 10.34 to Primerica's Annual Report on Form 10-K for the year ended December 31, 2015 (Commission File No. 001-34680). |
133
10.41* |
|
Employment Agreement, dated as of September 13, 2023, between Primerica, Inc. and Ms. Tracy X. Tan. |
|
Incorporated by reference to Exhibit 10.1 to Primerica’s Current Report on Form 8-K filed on September 14, 2023 (Commission File No. 001-34680). |
10.42* |
|
|
Incorporated by reference to Exhibit 10.31 to Primerica's Annual Report on Form 10-K for the year ended December 31, 2010 (Commission File No. 001-34680). |
|
21.1 |
|
|
Filed with the Securities and Exchange Commission as part of this Annual Report. |
|
23.1 |
|
|
Filed with the Securities and Exchange Commission as part of this Annual Report. |
|
31.1 |
|
Rule 13a-14(a)/15d-14(a) Certification, executed by Glenn J. Williams, Chief Executive Officer. |
|
Filed with the Securities and Exchange Commission as part of this Annual Report. |
31.2 |
|
|
Filed with the Securities and Exchange Commission as part of this Annual Report. |
|
32.1 |
|
|
Filed with the Securities and Exchange Commission as part of this Annual Report. |
|
97.1 |
|
|
Filed with the Securities and Exchange Commission as part of this Annual Report. |
|
101.INS |
|
Inline XBRL Instance Document |
|
The instance document does not appear in the Interactive Data File because its XBRL tags are embedded within the Inline XBRL document. |
101.SCH |
|
Inline XBRL Taxonomy Extension Schema With Embedded Linkbase Documents |
|
|
104 |
|
Cover Page Interactive Data File (formatted as Inline XBRL with applicable taxonomy extension information contained in Exhibits 101). |
|
|
* Identifies a management contract or compensatory plan or arrangement.
134
(c) Financial Statement Schedules.
Schedule I
Consolidated Summary of Investments — Other Than Investments in Related Parties
PRIMERICA, INC.
|
|
December 31, 2023 |
|
|||||||||
Type of Investment |
|
Cost |
|
|
Fair value |
|
|
Amount at which shown in the balance sheet |
|
|||
|
|
(In thousands) |
|
|||||||||
Fixed maturities: |
|
|
|
|
|
|
|
|
|
|||
Bonds(1): |
|
|
|
|
|
|
|
|
|
|||
United States government and government agencies and authorities |
|
$ |
|
|
$ |
|
|
$ |
|
|||
States, municipalities, and political subdivisions |
|
|
|
|
|
|
|
|
|
|||
Foreign governments |
|
|
|
|
|
|
|
|
|
|||
All other corporate bonds(1) |
|
|
|
|
|
|
|
|
|
|||
Certificates of deposit |
|
|
|
|
|
|
|
|
|
|||
Redeemable preferred stocks |
|
|
|
|
|
|
|
|
|
|||
Total fixed maturities |
|
|
|
|
|
|
|
|
|
|||
|
|
|
|
|
|
|
|
|
|
|||
Equity securities: |
|
|
|
|
|
|
|
|
|
|||
Common stocks: |
|
|
|
|
|
|
|
|
|
|||
Public utilities |
|
|
|
|
|
|
|
|
|
|||
Banks, trusts and insurance companies |
|
|
|
|
|
|
|
|
|
|||
Industrial, miscellaneous and all other |
|
|
|
|
|
|
|
|
|
|||
Nonredeemable preferred stocks |
|
|
|
|
|
|
|
|
|
|||
Total equity securities |
|
|
|
|
|
|
|
|
|
|||
Policy loans and other invested assets |
|
|
|
|
|
|
|
|
|
|||
Short-term investments |
|
|
|
|
|
|
|
|
|
|||
Total investments |
|
$ |
|
|
$ |
|
|
$ |
|
|||
See the report of independent registered public accounting firm.
135
Schedule II
Condensed Financial Information of Registrant
PRIMERICA, INC. (Parent Only)
Condensed Balance Sheets
|
|
December 31, |
|
|||||
|
|
2023 |
|
|
2022 |
|
||
|
|
(In thousands) |
|
|||||
Assets |
|
|
|
|
|
|
||
Investments: |
|
|
|
|
|
|
||
Fixed-maturity securities available-for-sale, at fair value (amortized cost: |
|
$ |
|
|
$ |
|
||
Short-term investments available-for-sale, at fair value (amortized cost: $ |
|
|
- |
|
|
|
|
|
Equity securities, at fair value (historical cost: $ |
|
|
- |
|
|
|
|
|
Other investments |
|
|
|
|
|
- |
|
|
Total investments |
|
|
|
|
|
|
||
Cash and cash equivalents |
|
|
|
|
|
|
||
Due from affiliates* |
|
|
|
|
|
|
||
Other receivables |
|
|
|
|
|
|
||
Income tax receivable |
|
|
|
|
|
|
||
Deferred income taxes |
|
|
|
|
|
|
||
Investment in subsidiaries* |
|
|
|
|
|
|
||
Other assets |
|
|
|
|
|
|
||
Total assets |
|
$ |
|
|
$ |
|
||
|
|
|
|
|
|
|
||
Liabilities and Stockholders’ Equity |
|
|
|
|
|
|
||
Liabilities: |
|
|
|
|
|
|
||
Notes payable |
|
$ |
|
|
$ |
|
||
Deferred income taxes |
|
|
|
|
|
|
||
Interest payable |
|
|
|
|
|
|
||
Other liabilities |
|
|
|
|
|
|
||
(see Note G) |
|
|
|
|
|
|
||
Total liabilities |
|
|
|
|
|
|
||
|
|
|
|
|
|
|
||
Temporary Stockholders' Equity |
|
|
|
|
|
|
||
Redeemable noncontrolling interests in consolidated entities |
|
|
- |
|
|
|
- |
|
Permanent Stockholders' Equity |
|
|
|
|
|
|
||
Equity attributable to Primerica, Inc.: |
|
|
|
|
|
|
||
Common stock ($ |
|
|
|
|
|
|
||
Paid-in capital |
|
|
- |
|
|
|
- |
|
Retained earnings |
|
|
|
|
|
|
||
Accumulated other comprehensive income, net of income tax |
|
|
( |
) |
|
|
( |
) |
Total permanent stockholders’ equity |
|
|
|
|
|
|
||
Total liabilities and temporary and permanent stockholders’ equity |
|
$ |
|
|
$ |
|
||
* Eliminated in consolidation.
Prior year amounts related to long-duration insurance contracts have been adjusted for the adoption of accounting guidance effective January 1, 2023.
See the accompanying notes to condensed financial statements.
See the report of independent registered public accounting firm.
136
Schedule II
Condensed Financial Information of Registrant
PRIMERICA, INC. (Parent Only)
Condensed Statements of Income
|
|
Year ended December 31, |
|
|||||||||
|
|
2023 |
|
|
2022 |
|
|
2021 |
|
|||
|
|
(In thousands) |
|
|||||||||
Revenues: |
|
|
|
|
|
|
|
|
|
|||
Dividends from subsidiaries* |
|
$ |
|
|
$ |
|
|
$ |
|
|||
Net investment income |
|
|
|
|
|
|
|
|
|
|||
Realized investment gains (losses) |
|
|
|
|
|
|
|
|
|
|||
Other investment gains (losses) |
|
|
|
|
|
( |
) |
|
|
|
||
Investment gains (losses), including credit losses |
|
|
|
|
|
|
|
|
|
|||
Total revenues |
|
|
|
|
|
|
|
|
|
|||
Expenses: |
|
|
|
|
|
|
|
|
|
|||
Interest expense, net |
|
|
|
|
|
|
|
|
|
|||
Loss on extinguishment of debt |
|
|
- |
|
|
|
- |
|
|
|
|
|
Other operating expenses |
|
|
|
|
|
|
|
|
|
|||
Total expenses |
|
|
|
|
|
|
|
|
|
|||
Income before income taxes |
|
|
|
|
|
|
|
|
|
|||
Income taxes |
|
|
( |
) |
|
|
( |
) |
|
|
( |
) |
Income before equity in undistributed earnings of subsidiaries |
|
|
|
|
|
|
|
|
|
|||
Equity in undistributed earnings of subsidiaries* |
|
|
|
|
|
|
|
|
|
|||
Net income |
|
$ |
|
|
$ |
|
|
$ |
|
|||
* Eliminated in consolidation.
Prior year amounts related to long-duration insurance contracts have been adjusted for the adoption of accounting guidance effective January 1, 2023.
See the accompanying notes to condensed financial statements.
See the report of independent registered public accounting firm.
137
Schedule II
Condensed Financial Information of Registrant
PRIMERICA, INC. (Parent Only)
Condensed Statements of Comprehensive Income
|
|
Year ended December 31, |
|
|||||||||
|
|
2023 |
|
|
2022 |
|
|
2021 |
|
|||
|
|
(In thousands) |
|
|||||||||
Net income |
|
$ |
|
|
$ |
|
|
$ |
|
|||
Other comprehensive income (loss) before income taxes: |
|
|
|
|
|
|
|
|
|
|||
Unrealized investment gains (losses): |
|
|
|
|
|
|
|
|
|
|||
Equity in unrealized holding gains (losses) on investment securities |
|
|
|
|
|
( |
) |
|
|
( |
) |
|
Change in unrealized holding gains (losses) on investment securities |
|
|
|
|
|
( |
) |
|
|
( |
) |
|
Reclassification adjustment for realized investment (gains) losses |
|
|
( |
) |
|
|
( |
) |
|
|
( |
) |
Equity in effect of change in discount rate assumptions on the liability for |
|
|
( |
) |
|
|
|
|
|
|
||
Foreign currency translation adjustments: |
|
|
|
|
|
|
|
|
|
|||
Equity in unrealized foreign currency translation gains (losses) of subsidiaries |
|
|
|
|
|
( |
) |
|
|
|
||
Total other comprehensive income (loss) before income taxes |
|
|
( |
) |
|
|
|
|
|
|
||
Income tax expense (benefit) related to items of other comprehensive |
|
|
|
|
|
( |
) |
|
|
( |
) |
|
Other comprehensive income (loss), net of income taxes |
|
|
( |
) |
|
|
|
|
|
|
||
Total comprehensive income |
|
$ |
|
|
$ |
|
|
$ |
|
|||
Prior year amounts related to long-duration insurance contracts have been adjusted for the adoption of accounting guidance effective January 1, 2023.
See the accompanying notes to condensed financial statements.
See the report of independent registered public accounting firm.
138
Schedule II
Condensed Financial Information of Registrant
PRIMERICA, INC. (Parent Only)
Condensed Statements of Cash Flows
|
|
Year ended December 31, |
|
|
|||||||||
|
|
2023 |
|
|
2022 |
|
|
2021 |
|
|
|||
|
|
(In thousands) |
|
|
|||||||||
Cash flows from operating activities: |
|
|
|
|
|
|
|
|
|
|
|||
Net income |
|
$ |
|
|
$ |
|
|
$ |
|
|
|||
Adjustments to reconcile net income to cash provided by (used in) operating activities: |
|
|
|
|
|
|
|
|
|
|
|||
Equity in undistributed earnings of subsidiaries* (1) |
|
|
( |
) |
|
|
( |
) |
|
|
( |
) |
|
Deferred tax provision |
|
|
|
|
|
|
|
|
( |
) |
|
||
Change in income taxes |
|
|
|
|
|
|
|
|
( |
) |
|
||
Investment (gains) losses |
|
|
( |
) |
|
|
( |
) |
|
|
( |
) |
|
Accretion and amortization of investments |
|
|
( |
) |
|
|
|
|
|
|
|
||
Share-based compensation |
|
|
|
|
|
|
|
|
|
|
|||
Change in due to/from affiliates* (2) |
|
|
|
|
|
|
|
|
( |
) |
|
||
Trading securities sold, matured, or called (acquired), net |
|
|
- |
|
|
|
- |
|
|
|
- |
|
|
Change in other operating assets and liabilities, net |
|
|
|
|
|
|
|
|
( |
) |
|
||
Loss on extinguishment of debt |
|
|
- |
|
|
|
- |
|
|
|
|
|
|
Net cash provided by (used in) operating activities |
|
|
|
|
|
|
|
|
|
|
|||
|
|
|
|
|
|
|
|
|
|
|
|||
Cash flows from investing activities: |
|
|
|
|
|
|
|
|
|
|
|||
Available-for-sale investments sold, matured or called: |
|
|
|
|
|
|
|
|
|
|
|||
Fixed maturity securities — sold |
|
|
|
|
|
|
|
|
- |
|
|
||
Fixed-maturity securities — matured or called |
|
|
|
|
|
|
|
|
|
|
|||
Short-term investments —sold |
|
|
- |
|
|
|
- |
|
|
|
|
|
|
Short-term investments — matured or called |
|
|
|
|
|
|
|
|
|
|
|||
Equity securities — sold |
|
|
|
|
|
|
|
|
|
|
|||
Available-for-sale investments acquired: |
|
|
|
|
|
|
|
|
|
|
|||
Fixed-maturity securities(1) |
|
|
( |
) |
|
|
( |
) |
|
|
( |
) |
|
Short-term investments |
|
|
( |
) |
|
|
( |
) |
|
|
( |
) |
|
Equity securities acquired |
|
|
( |
) |
|
|
( |
) |
|
|
( |
) |
|
Purchase of business, net of cash acquired |
|
|
|
|
|
|
|
|
( |
) |
|
||
Other investing activities |
|
|
( |
) |
|
|
- |
|
|
|
- |
|
|
Net cash provided by (used in) investing activities |
|
|
|
|
|
|
|
|
( |
) |
|
||
|
|
|
|
|
|
|
|
|
|
|
|||
Cash flows from financing activities: |
|
|
|
|
|
|
|
|
|
|
|||
Dividends paid |
|
|
( |
) |
|
|
( |
) |
|
|
( |
) |
|
Common stock repurchased |
|
|
( |
) |
|
|
( |
) |
|
|
( |
) |
|
Proceeds from revolving credit facility |
|
|
- |
|
|
|
- |
|
|
|
|
|
|
Repayment of revolving credit facility |
|
|
- |
|
|
|
- |
|
|
|
( |
) |
|
Proceeds from issuance of debt |
|
|
- |
|
|
|
- |
|
|
|
|
|
|
Debt issuance costs |
|
|
- |
|
|
|
- |
|
|
|
( |
) |
|
Repayment of debt |
|
|
- |
|
|
|
- |
|
|
|
( |
) |
|
Tax withholdings on share-based compensation |
|
|
( |
) |
|
|
( |
) |
|
|
( |
) |
|
Net cash provided by (used in) financing activities |
|
|
( |
) |
|
|
( |
) |
|
|
|
|
|
Change in cash and cash equivalents |
|
|
|
|
|
|
|
|
( |
) |
|
||
Cash and cash equivalents, beginning of period |
|
|
|
|
|
|
|
|
|
|
|||
Cash and cash equivalents, end of period |
|
$ |
|
|
$ |
|
|
$ |
|
|
|||
|
|
|
|
|
|
|
|
|
|
|
|||
Supplement disclosures: |
|
|
|
|
|
|
|
|
|
|
|||
Interest paid |
|
$ |
|
|
$ |
|
|
$ |
|
|
|||
|
|
|
|
|
|
|
|
|
|
|
|||
* Eliminated in consolidation.
Prior year amounts related to long-duration insurance contracts have been adjusted for the adoption of accounting guidance effective January 1, 2023.
See the accompanying notes to condensed financial statements.
See the report of independent registered public accounting firm.
139
Schedule II
Condensed Financial Information of Registrant
PRIMERICA, INC. (Parent Only)
Notes to Condensed Financial Statements
(A) Description of Business
Primerica, Inc. (“we”, “us” or the “Company”) is a holding company with our primary asset being the capital stock of our wholly owned operating subsidiaries, and our primary liability being $
(B) Basis of Presentation
These condensed financial statements reflect the results of operations, financial position and cash flows for the Company. We prepare our financial statements in accordance with U.S. generally accepted accounting principles (“U.S. GAAP”). These principles are established primarily by the Financial Accounting Standards Board. The preparation of financial statements in conformity with U.S. GAAP requires us to make estimates and assumptions that affect financial statement balances, revenues and expenses and cash flows, as well as the disclosure of contingent assets and liabilities. Management considers available facts and knowledge of existing circumstances when establishing the estimates included in our financial statements.
The most significant item that involves a greater degree of accounting estimates subject to change in the future is the determination of our investments in subsidiaries. Estimates for this and other items are subject to change and are reassessed by management in accordance with U.S. GAAP. Actual results could differ from those estimates.
The accompanying condensed financial statements should be read in conjunction with the consolidated financial statements and notes thereto of Primerica, Inc. and subsidiaries included in Part II, Item 8 of this report.
(C) Summary of Significant Accounting Policies
In August 2018, the Financial Accounting Standards Board issued , Financial Services—Insurance (Topic 944) — Targeted Improvements to the Accounting for Long-Duration Contracts (“ASU 2018-12”). The amendments in this update changed accounting guidance for insurance companies that issue long-duration contracts, such as and segregated funds products. The Company
(D) Notes Payable
Notes Payable. As of December 31, 2023, we had $
140
As unsecured senior obligations, the Senior Notes rank equally in right of payment with all existing and future unsubordinated indebtedness and senior to all existing and future subordinated indebtedness of the Company. The Senior Notes are structurally subordinated in right of payment to all existing and future liabilities of our subsidiaries. In addition, the Senior Notes contain covenants that restrict our ability to, among other things, create or incur any indebtedness that is secured by a lien on the capital stock of certain of our subsidiaries, and merge, consolidate or sell all or substantially all of our properties and assets.
(E) Revolving Credit Facility
On June 22, 2021, we amended and restated our unsecured $
(F) Dividends
For the years ended December 31, 2023, 2022, and 2021, the Company received dividends from our non-life insurance subsidiaries of $
(G) Commitments and Contingent Liabilities
Vidalia Re has entered into a coinsurance agreement with Primerica Life whereby Primerica Life has ceded certain level-premium term life insurance policies to Vidalia Re. In conjunction with the coinsurance agreement, we have a capital maintenance agreement with Vidalia Re. The capital maintenance agreement may require us at times to make capital contributions to Vidalia Re to ensure that its regulatory account, as defined in the coinsurance agreement with Primerica Life, will not be less than $
The Company is involved from time-to-time in legal disputes, regulatory inquiries and arbitration proceedings in the normal course of business. These disputes are subject to uncertainties, including large and/or indeterminate amounts sought in certain of these matters and the inherent unpredictability of litigation. As such, the Company is unable to estimate the possible loss or range of loss that may result from these matters.
141
Schedule III
Supplementary Insurance Information
PRIMERICA, INC.
|
|
Deferred policy acquisition costs |
|
|
Future policy benefits |
|
|
Unearned and advance premiums |
|
|
Policy claims and other benefits payable |
|
|
Separate account liabilities |
|
|||||
|
|
(In thousands) |
|
|||||||||||||||||
December 31, 2023 |
|
|
|
|
|
|
|
|
|
|
|
|
|
|
|
|||||
Term Life Insurance |
|
$ |
|
|
$ |
|
|
$ |
|
|
$ |
|
|
$ |
- |
|
||||
Investment and Savings Products |
|
|
|
|
|
- |
|
|
|
- |
|
|
|
- |
|
|
|
|
||
Senior Health |
|
|
- |
|
|
|
- |
|
|
|
- |
|
|
|
- |
|
|
|
- |
|
Corporate and Other Distributed Products |
|
|
|
|
|
|
|
|
|
|
|
|
|
|
|
|||||
Total |
|
$ |
|
|
$ |
|
|
$ |
|
|
$ |
|
|
$ |
|
|||||
|
|
|
|
|
|
|
|
|
|
|
|
|
|
|
|
|||||
December 31, 2022 |
|
|
|
|
|
|
|
|
|
|
|
|
|
|
|
|||||
Term Life Insurance |
|
$ |
|
|
$ |
|
|
$ |
|
|
$ |
|
|
$ |
- |
|
||||
Investment and Savings Products |
|
|
|
|
|
- |
|
|
|
- |
|
|
|
- |
|
|
|
|
||
Senior Health |
|
|
- |
|
|
|
- |
|
|
|
- |
|
|
|
- |
|
|
|
- |
|
Corporate and Other Distributed Products |
|
|
|
|
|
|
|
|
|
|
|
|
|
|
|
|||||
Total |
|
$ |
|
|
$ |
|
|
$ |
|
|
$ |
|
|
$ |
|
|||||
|
|
Premium revenue |
|
|
Net investment income |
|
|
Benefits and claims |
|
|
Amortization of deferred policy acquisition costs |
|
|
Other operating expenses |
|
|
Premiums written |
|
||||||
|
|
(In thousands) |
|
|||||||||||||||||||||
Year ended December 31, 2023 |
|
|
|
|
|
|
|
|
|
|
|
|
|
|
|
|
|
|
||||||
Term Life Insurance |
|
$ |
|
|
$ |
- |
|
|
$ |
|
|
$ |
|
|
$ |
|
|
$ |
- |
|
||||
Investment and Savings Products |
|
|
- |
|
|
|
- |
|
|
|
- |
|
|
|
|
|
|
|
|
|
- |
|
||
Senior Health |
|
|
- |
|
|
|
- |
|
|
|
- |
|
|
|
- |
|
|
|
|
|
|
- |
|
|
Corporate and Other Distributed Products |
|
|
|
|
|
|
|
|
|
|
|
|
|
|
|
|
|
|
||||||
Total |
|
$ |
|
|
$ |
|
|
$ |
|
|
$ |
|
|
$ |
|
|
$ |
|
||||||
|
|
|
|
|
|
|
|
|
|
|
|
|
|
|
|
|
|
|
||||||
Year ended December 31, 2022 |
|
|
|
|
|
|
|
|
|
|
|
|
|
|
|
|
|
|
||||||
Term Life Insurance |
|
$ |
|
|
$ |
- |
|
|
$ |
|
|
$ |
|
|
$ |
|
|
$ |
- |
|
||||
Investment and Savings Products |
|
|
- |
|
|
|
- |
|
|
|
- |
|
|
|
|
|
|
|
|
|
- |
|
||
Senior Health |
|
|
- |
|
|
|
- |
|
|
|
- |
|
|
|
- |
|
|
|
|
|
|
- |
|
|
Corporate and Other Distributed Products |
|
|
|
|
|
|
|
|
|
|
|
|
|
|
|
|
|
|
||||||
Total |
|
$ |
|
|
$ |
|
|
$ |
|
|
$ |
|
|
$ |
|
|
$ |
|
||||||
|
|
|
|
|
|
|
|
|
|
|
|
|
|
|
|
|
|
|
||||||
Year ended December 31, 2021 |
|
|
|
|
|
|
|
|
|
|
|
|
|
|
|
|
|
|
||||||
Term Life Insurance |
|
$ |
|
|
$ |
- |
|
|
$ |
|
|
$ |
|
|
$ |
|
|
$ |
- |
|
||||
Investment and Savings Products |
|
|
- |
|
|
|
- |
|
|
|
- |
|
|
|
|
|
|
|
|
|
- |
|
||
Senior Health |
|
|
- |
|
|
|
- |
|
|
|
- |
|
|
|
- |
|
|
|
|
|
|
- |
|
|
Corporate and Other Distributed Products |
|
|
|
|
|
|
|
|
|
|
|
|
|
|
|
|
|
|
||||||
Total |
|
$ |
|
|
$ |
|
|
$ |
|
|
$ |
|
|
$ |
|
|
$ |
|
||||||
See the report of independent registered public accounting firm.
142
Schedule IV
Reinsurance
PRIMERICA, INC.
|
|
Year ended December 31, 2023 |
|
|||||||||||||||||
|
|
Gross amount |
|
|
Ceded to other companies |
|
|
Assumed from other companies |
|
|
Net amount |
|
|
Percentage of amount assumed to net |
|
|||||
|
|
(Dollars in thousands) |
|
|||||||||||||||||
|
|
|
|
|
|
|
|
|
|
|
|
|
|
|
|
|||||
Life insurance in force |
|
$ |
|
|
$ |
|
|
$ |
- |
|
|
$ |
|
|
|
— |
% |
|||
|
|
|
|
|
|
|
|
|
|
|
|
|
|
|
|
|||||
Premiums: |
|
|
|
|
|
|
|
|
|
|
|
|
|
|
|
|||||
Life insurance |
|
$ |
|
|
$ |
|
|
$ |
- |
|
|
$ |
|
|
|
— |
% |
|||
Accident and health insurance |
|
|
|
|
|
- |
|
|
|
- |
|
|
|
|
|
|
— |
% |
||
Total premiums |
|
$ |
|
|
$ |
|
|
$ |
- |
|
|
$ |
|
|
|
— |
% |
|||
|
|
|
|
|
|
|
|
|
|
|
|
|
|
|
|
|||||
|
|
Year ended December 31, 2022 |
|
|||||||||||||||||
|
|
Gross amount |
|
|
Ceded to other companies |
|
|
Assumed from other companies |
|
|
Net amount |
|
|
Percentage of amount assumed to net |
|
|||||
|
|
(Dollars in thousands) |
|
|||||||||||||||||
|
|
|
|
|
|
|
|
|
|
|
|
|
|
|
|
|||||
Life insurance in force |
|
$ |
|
|
$ |
|
|
$ |
- |
|
|
$ |
|
|
|
— |
% |
|||
|
|
|
|
|
|
|
|
|
|
|
|
|
|
|
|
|||||
Premiums: |
|
|
|
|
|
|
|
|
|
|
|
|
|
|
|
|||||
Life insurance |
|
$ |
|
|
$ |
|
|
$ |
- |
|
|
$ |
|
|
|
— |
% |
|||
Accident and health insurance |
|
|
|
|
|
|
|
|
- |
|
|
|
|
|
|
— |
% |
|||
Total premiums |
|
$ |
|
|
$ |
|
|
$ |
- |
|
|
$ |
|
|
|
— |
% |
|||
|
|
|
|
|
|
|
|
|
|
|
|
|
|
|
|
|||||
|
|
Year ended December 31, 2021 |
|
|||||||||||||||||
|
|
Gross amount |
|
|
Ceded to other companies |
|
|
Assumed from other companies |
|
|
Net amount |
|
|
Percentage of amount assumed to net |
|
|||||
|
|
(Dollars in thousands) |
|
|||||||||||||||||
|
|
|
|
|
|
|
|
|
|
|
|
|
|
|
|
|||||
Life insurance in force |
|
$ |
|
|
$ |
|
|
$ |
- |
|
|
$ |
|
|
|
— |
% |
|||
|
|
|
|
|
|
|
|
|
|
|
|
|
|
|
|
|||||
Premiums: |
|
|
|
|
|
|
|
|
|
|
|
|
|
|
|
|||||
Life insurance |
|
$ |
|
|
$ |
|
|
$ |
- |
|
|
$ |
|
|
|
— |
% |
|||
Accident and health insurance |
|
|
|
|
|
|
|
|
- |
|
|
|
|
|
|
— |
% |
|||
Total premiums |
|
$ |
|
|
$ |
|
|
$ |
- |
|
|
$ |
|
|
|
— |
% |
|||
See the report of independent registered public accounting firm.
ITEM 16. FORM 10-K SUMMARY.
Not applicable.
143
SIGNATURES
Pursuant to the requirements of Section 13 or 15(d) of the Securities Exchange Act of 1934, the registrant has duly caused this report to be signed on its behalf by the undersigned, thereunto duly authorized.
Primerica, Inc.
By: |
|
/s/ Tracy X. Tan |
|
February 28, 2024 |
|
|
Tracy X. Tan |
|
|
|
|
Executive Vice President and |
|
|
|
|
Chief Financial Officer |
|
|
Pursuant to the requirements of the Securities Exchange Act of 1934, this report has been signed below by the following persons on behalf of the registrant and in the capacities and on the dates indicated.
/s/ D. Richard Williams |
|
Chairman of the Board |
|
February 28, 2024
|
D. Richard Williams |
|
|
||
|
|
|
|
|
/s/ Glenn J. Williams |
|
Chief Executive Officer (Principal Executive Officer) and Director |
|
February 28, 2024
|
Glenn J. Williams |
|
|
||
|
|
|
|
|
/s/ Tracy X. Tan |
|
Executive Vice President and Chief Financial Officer (Principal Financial Officer) |
|
February 28, 2024
|
Tracy X. Tan |
|
|
||
|
|
|
|
|
/s/ Nicholas A. Jendusa |
Executive Vice President and Controller (Principal Accounting Officer) |
|
February 28, 2024 |
|
|
||||
Nicholas A. Jendusa |
|
|
|
|
|
|
|
|
|
/s/ John A. Addison, Jr. |
|
Director |
|
February 28, 2024
|
John A. Addison, Jr. |
|
|
||
|
|
|
|
|
/s/ Joel M. Babbit |
|
Director |
|
February 28, 2024
|
Joel M. Babbit |
|
|
||
|
|
|
|
|
/s/ Amber L. Cottle |
|
Director |
|
February 28, 2024
|
Amber L. Cottle |
|
|
||
|
|
|
|
|
/s/ Gary L. Crittenden |
|
Director |
|
February 28, 2024
|
Gary L. Crittenden |
|
|
||
|
|
|
|
|
/s/ Cynthia N. Day |
|
Director |
|
February 28, 2024
|
Cynthia N. Day |
|
|
||
|
|
|
|
|
/s/ Sanjeev Dheer |
|
Director |
|
February 28, 2024
|
Sanjeev Dheer |
|
|
||
/s/ Beatriz R. Perez |
|
Director |
|
February 28, 2024
|
Beatriz R. Perez |
|
|
144
|
|
|
|
|
/s/ Darryl L. Wilson |
|
Director |
|
February 28, 2024
|
Darryl L. Wilson |
|
|
||
|
|
|
|
|
/s/ Barbara A. Yastine |
|
Director |
|
February 28, 2024
|
Barbara A. Yastine |
|
|
||
|
|
|
|
|
145